How to correctly present a measurement result
When we do a measurement, for example a length measurement, it is not correct to only present the measured length.
When we do a measurement, for example a length measurement, it is not correct to only present the measured length, for example $5 mm$. Very often, we think that by adding intervals on the measured length, that is $(5\pm 0.1) mm$, will make the measurement result presentation complete. This result presentation is not enough.
The complete presentation of a measurement result (for all types of measurements, for example length, temperature, current, time and pressure measurements) should have at least this information:
· The measurement result $y$ in the format of $y=x\pm U$, where $x$ is the measured value and $U$ is the expanded uncertainty of the measured value
· The explanations of the $U$ value, such as the confidence interval and the assumption of its statistical distribution
· The explanations of how $U$ is determined, such as how many repetitions of measurements, what methods used to estimate the $U$, where the measurement is performed, who the operator is and what the contributors of $U$ are.
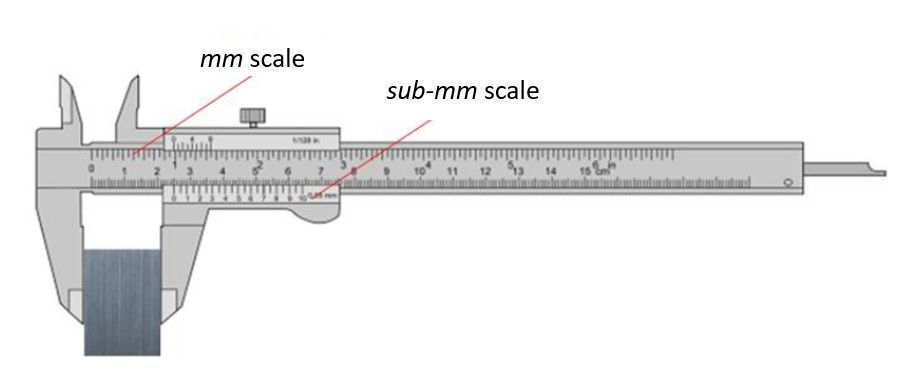
For example, we perform a length measurement by using a vernier calliper. Then, to completely present the measurement results, we must report the results as:
· The length of the block is $(2.4\pm 0.5) mm$
· The interval $0.5 mm$ is the expanded uncertainty with $95%$ confidence interval assuming a normal distribution ($k=2$)
· The length $2.4 mm$ is an average value from five measurement repetitions. The expanded uncertainty is estimated by using a spreadsheet method. The measurement was performed in a temperature-controlled room at $(20\pm 0.5)^{\circ} C$ and by a trained operator. The uncertainty contributors are repeatability, reproducibility, temperature variation and calibration uncertainty.
We sell tutorials (containing PDF files, MATLAB scripts and CAD files) about 3D tolerance stack-up analysis based on statistical method (Monte-Carlo/MC Simulation).