Is research expensive?
People always ask: “is research expensive?” and how much advanced countries spend their money on research. The answer is obviously yes, but also NO. here is why.

People always ask: “Is research expensive?” and how much-advanced countries spend their money on research? The answer is obviously yes, but also NO. here is why.
Supply vs demand
The basics of a profitable economy is supply and demand. The higher the supply than the demand of a product, the higher the price and the profit margin of the product, and otherwise. Supplies are set by sellers and demands are set by buyers.
High-value products (and services) require extensive knowledge, obtained from research activities. This requirement causes only some companies (or even in some cases only very few companies) can offer the products or services and creates supply limitations for the products and services. With limited supplies and constant or even higher demands, the selling price of the products and services can be increased so that a high-profit margin can be obtained. This high profit-margin economy makes advanced countries what they are now. Producing high-value products and services is the key to going from a middle-income country to a high-income (advanced) country.
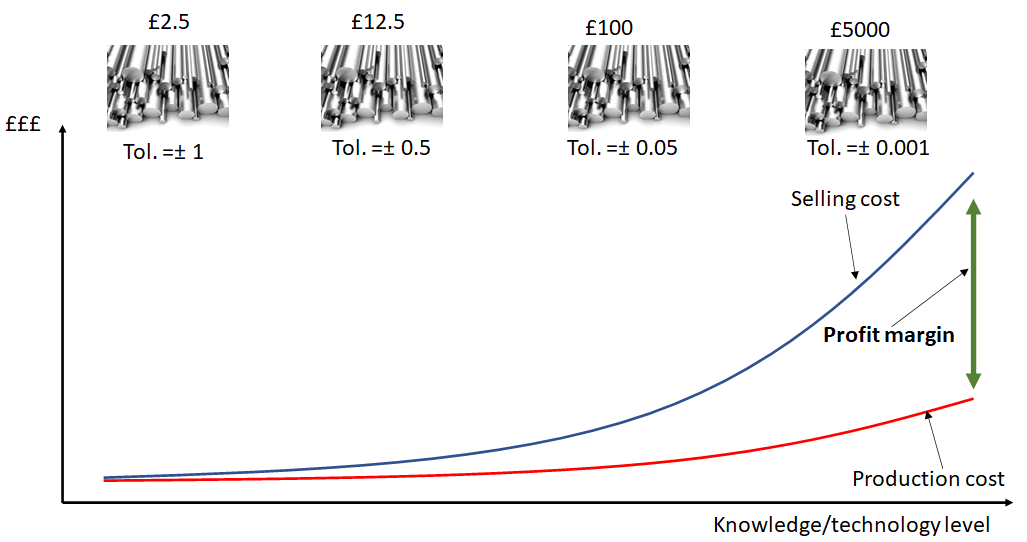
Figure 1 shows an illustration of how high-value products or services can increase profit margins. In Figure 1, we present a hypothetical example in manufacturing. Suppose we have blocks of metal cylinders. When the diameter of the cylinders has ± 1mm tolerances, the selling price of the cylinders is around £2.5. When the tolerance of the produced cylinders is reduced to ± 0.5mm (that is the accuracy of the cylinders improved), the selling price will be increased to £12.5. When the accuracy of cylinders again improves, the selling price will be higher, up to exponentially, than those with less accuracy. Due to the high price, the profit margin of selling high-accuracy cylinders will be high as well. Although the production cost of high-accuracy cylinders will be higher than those with less accuracy, since not many companies can offer high-accuracy cylinders (supplies become limited), we can set the selling price very high and have high-profit margins.
Technology readiness level
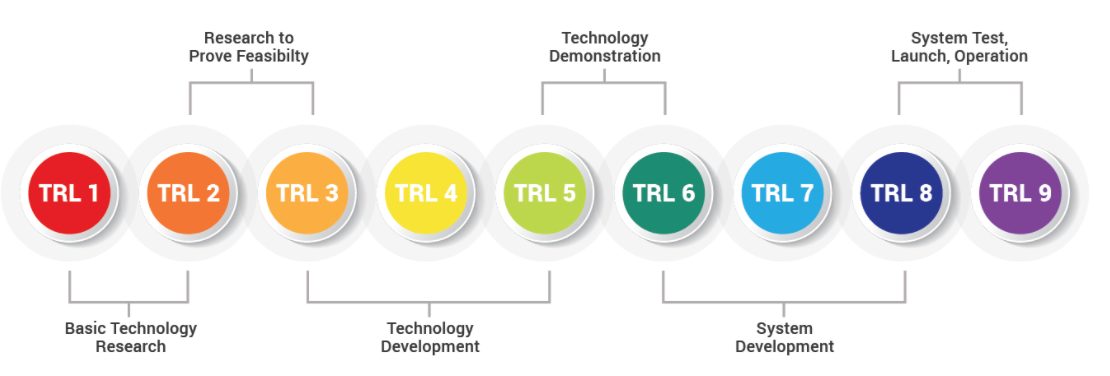
It is already common that the level of research and development maturity is represented as the technology readiness level (TRL). This level describes what phases of research and development are by dividing the phase into nine levels, from TRL 1 to TRL 9. The TRL levels are shown in Figure 2.
In Figure 2, TRL 1 and TRL 2 describe the stage of basic research where basic science phenomena are studied. These basic phenomena include the fields of engineering, social and economics (not only science and medicine). The outputs of TRL 1 and TRL 2 are usually the proof of concepts or models of observations in the form of paper publications or technical reports (TRL 3).
Starting at TRL 4, the proof of concepts starts to be developed further to produce technology demonstrations, commonly in the form of working prototypes (TRL 5 and TRL 6). TRL 7 starts to develop further the working prototypes (from TRL 6) to be ready for production at TRL 9. During TRL 7 and TRL 8, the infrastructure of the product developments is prepared, for example, manufacturing systems, logistic systems and marketing systems. Before products/services launch at TRL 9, comprehensive tests of the products/services are carried out. Finally, the products/services can enter the market, that is to be sold to customers.
Government and industry funding responsibility
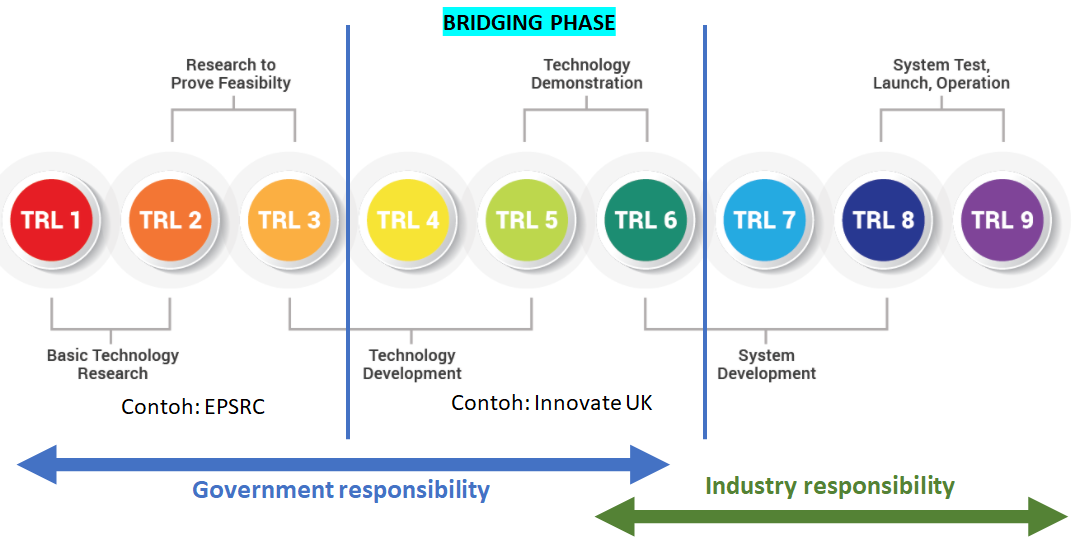
Research is a very high-risk activity in the sense that its output might likely not be as expected. Due to this high risk, the source of funding is also limited. Basically, there are two main sources of funding for research: government and industry funding. Figure 3 shows the phases in which the government or industry should fund the research.
From Figure 3, It is the job of the government of a country to fund research at TRL 1 to TRL 6. The government funds the research carried out in universities or governmental research institutes (for example to pay the salary of researchers, purchasing research equipment, conference travel costs and consumable research materials). The academics and researchers at the universities and research institutes conduct the funded research.
Meanwhile, the industry should fund research from TRL 5 to TRL 9 (although perhaps there are some large industries that can fund research starting at TRL 1 as well, but usually they will cooperate with universities or private research institutes). The research starting at TRL 5 or TRL 6 should be carried out at industrial laboratories (the research should be carried out from university laboratories, although there are cases where they outsource the research to universities and still use university laboratories). The government can support the research at TRL 7 to TRL 9 by providing policies that support industrial research, for example, tax reduction or permissions to build industrial infrastructures.
There is an intersection between government and industrial funding at TRL 5 and TRL 6 (figure 3). TRL 5 and TRL 6 are important phases because at these phases the output of basic research will be translated to applied research and to industry. Commonly, the funding composition at TRL 5 and TRL 6 is 80% from the government and 20% from industry, for example in Innovate UK projects in the United Kingdom (UK).
How much to invest?
This is one common question to answer. Let’s see in the case of the UK government. For 2021-2022, the government prepared a budget of £14.9 billion to spend for research and development activities. Their target is to invest 2.4% of the total gross domestic product (GDP) in research in 2024.
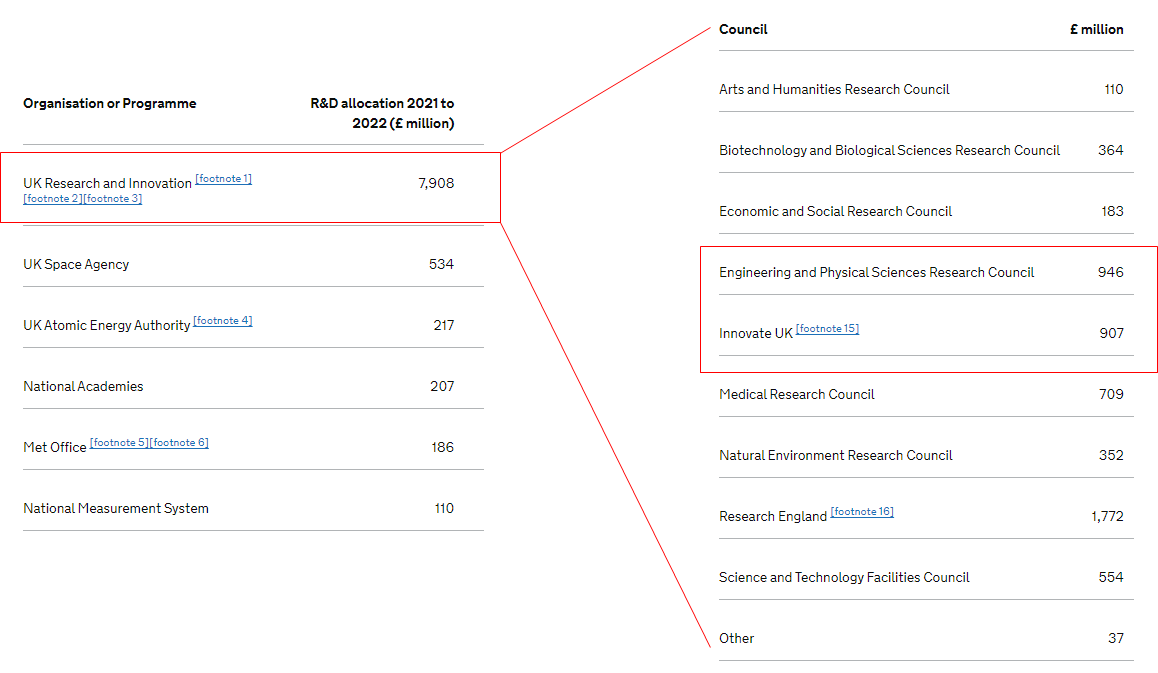
The £14.9 billion is distributed into six main research organisations: UK Research and Innovation (UKRI), UK Space Agency, UK Atomic Energy Authority, national academies, the Met Office and national measurement systems (Figure 4). From Figure 4, specifically for engineering, from UKRI, the funding is distributed to the Engineering and Physical Science Research Council (EPSRC) for TRL 1 to TRL 3 and Innovate UK for TRL 4 to TRL 6.
This £14.9 billion is a lot of money and shows that research is expensive. However, we cannot stop here and should look further ahead!
Is research really expensive?
To answer this question, let’s use rough assumptions and make a small simulation to perform a cost-benefit analysis. Figure 5 shows an illustration of how long it will take to develop a product from TRL 1 (from basic research) to TRL 9 (ready-to-market products). In Figure 5, we use a rough estimate of 15-year period to develop a product from TRL 1 to TRL 9. This 15 years assumption considers the average development time in medicine (±10 years) and energy sector (±20 years). A funnel diagram is shown in Figure 5 to represent the large number of projects at TRL 1 and only a small number of projects achieve TRL 9 to produce ready-to-market products or services.
From Figure 5, let’s assume the yearly budget for research is £10 billion. The total spending during 15 years of research to create high-value products or services, is £150 billion. Let’s also assume the number of funded projects, to develop for example new methods, products or services, at TRL 1 is ± 750 projects (we just look at one specific EPSRC funding). Finally, let's also assume only 1% of the total 750 projects, that is around 7-8 projects) will result in companies that produce high-value products or services. Note that the real number of total projects will be much higher than 750 since there are a lot of research organisation in the UK other than EPSRC as shown in figure 4.
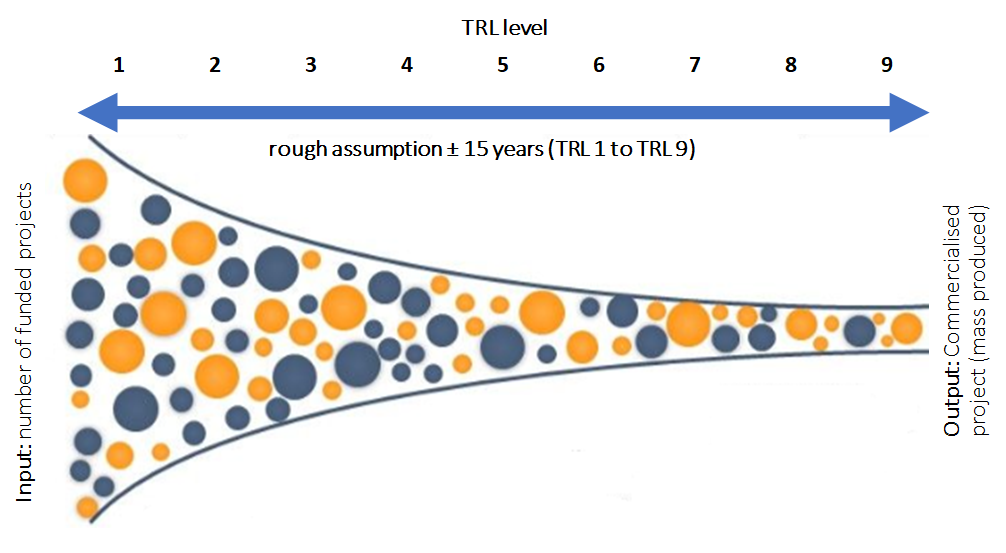
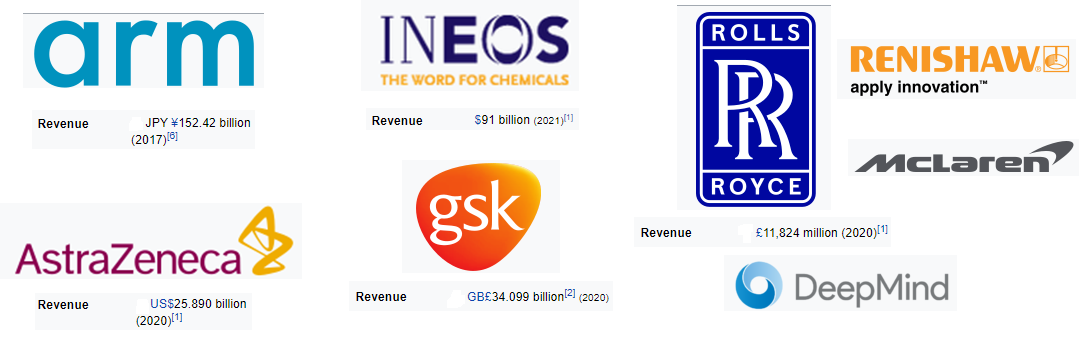
From these 7-8 high-technology companies, these companies can generate a total of hundreds of billions of economic values per year. Figure 6 presents just a few examples of high-technology companies that generate billions of pounds per year (the total gross revenue). Hence, with only 7-8 projects that reach TRL 9 (in the form of the companies and their products/services), all the £150 billion spent during the period of 15 years are paid off. Also, these companies will continuously generate billions in the years to come. In reality, high-technology companies resulting from the projects will be more than 7-8 companies since the number of projects is also more than 750.
Not only economic values be generated from 15 years of research, but also other benefits will be created, for example, the creation of critical masses of knowledge in many inter-disciplinary fields to support further developments, many high-skilled jobs and many new scientists and engineers.
In the context of the current pandemic, Let's see examples of AstraZeneca, Pfizer and other companies that can make vaccines for Covid-19 within 1-1.5 years. These companies in collaboration with universities and research institutes, many years before the pandemic, have constantly invested money, time and labour to conduct research in virology and vaccines. They have created a critical mass in the field of virology and immunology, for example, virus and vaccine experts, vaccine development methodologies, vaccine manufacturing methods, vaccine logistic systems, etc. The Covid-19 vaccine is just the tip of the iceberg, that is there were many years of work before the pandemic so they have “a boilerplate” or a template that can be used to make the vaccine for Covid-19 within a relatively very short period of time.
Finally, we have the answer to the question of “Is research expensive?”. The answer is yes if we look at the short-term period, but is absolutely NOT if we look at the long term period many years ahead.
We sell all the source files, EXE file, include and LIB files as well as documentation of ellipse fitting by using C/C++, Qt framework, Eigen and OpenCV libraries in this link.
We sell tutorials (containing PDF files, MATLAB scripts and CAD files) about 3D tolerance stack-up analysis based on statistical method (Monte-Carlo/MC Simulation).