Quick RF signal quality test: Comparison of different performances of low noise amplifies (LNAs)
This post will evaluate the performance of different low noise amplifiers (LNAs) at three different price segments.
This post will evaluate the performance of different low noise amplifiers (LNAs) at three different price segments.
Although classified as active device and increase the power (gain) of a signal, each LNA also has noise figure (NF) [1].
This NF will somehow degrade the quality of the signals. However, the noise is expected to be much smaller compared to the power gain a LNA provides.
In market, there are various LNAs with various price ranges, depending on our applications, there will be the optimal trade-off between the price of an LNA and the noise the LNA has with respect to its power gain.
In this post, we will compare the performance of three LNAs including expensive (~2500£), medium (~210£) and cheap (~50£) LNAs with respect to the quality of GNSS signal processing.
READ MORE: TUTORIAL on how to measure RF receiver noise: A practical approach
The effect of different LNAs on GNSS signal processing
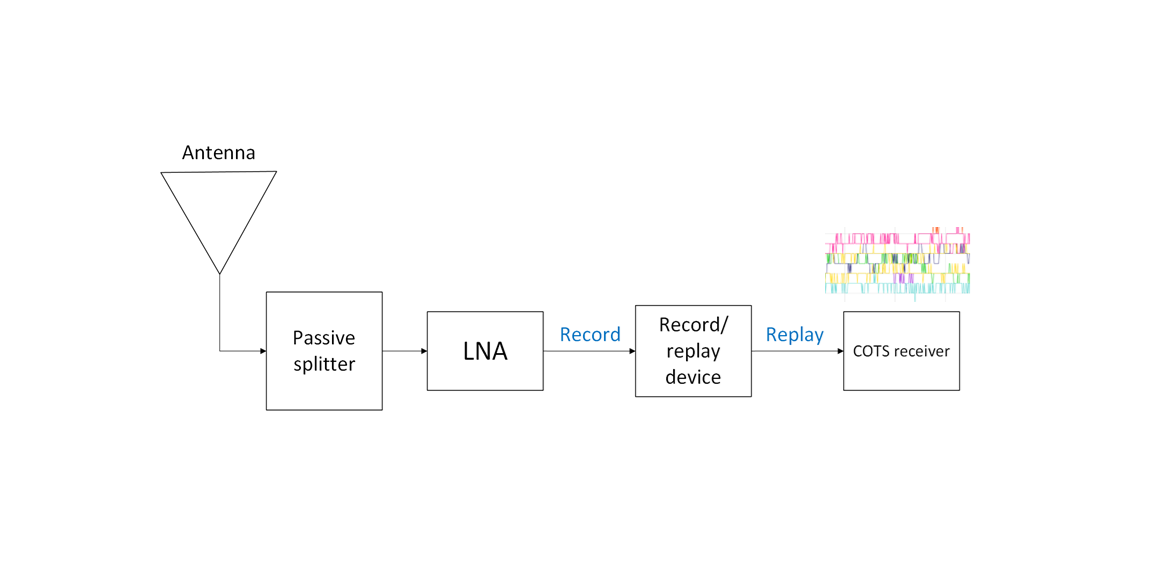
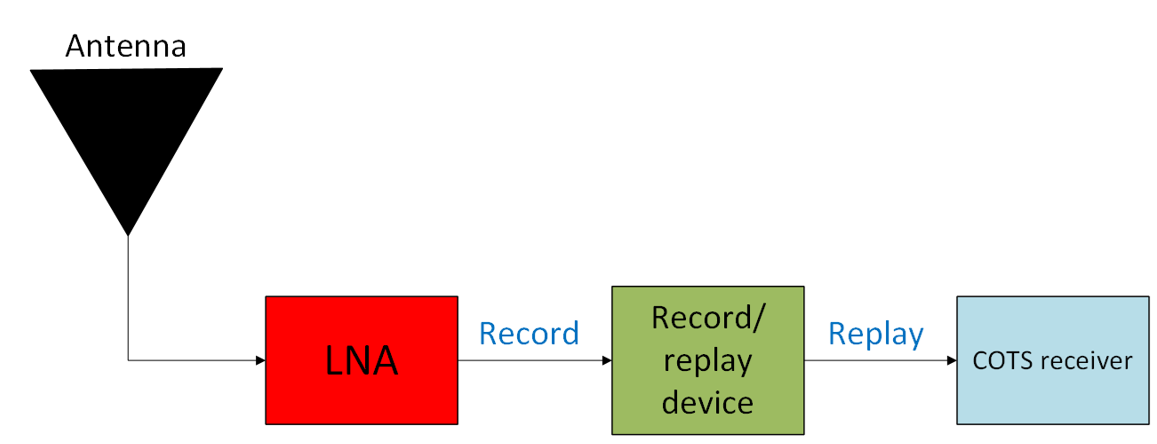
In this test, we put different LNAs on a RF record & replay devices (R&R device) and use GNSS signals to compare the quality of the signal with respect to the tracked C/N0 of the processed signals.
Figure 1 below shows the RF chain configuration to test the LNA performances. From figure 1, the LNA is placed between the antenna and the R&R device so that the signal coming to the R&R device has enough power to be processed.
The processed signals are then replayed to a commercially-of-the-self (COTS) GNSS receiver. The tracked C/N0 is used to gauge the quality of the signals.
The three LNA are as follows:
- LNA type 1: expensive with price of ~2500£ and with gain up to +30dB.
- LNA type 2: medium with price of ~210£ and with gain up to +30dB.
- LNA type 3: cheap with price of ~50£ and with gain up to +19dB.
From processing the signals using the three different LNAs, we can obtain the tracked C/N0 and compare among them to measure the quality of the three LNAs.
Figure 2 below shows the tracked C/N0 of the processed signal by using the three types of LNA in the RF chain.
From the results shown in figure 2, we can observe that the performance of LNA type 1 and type 2 are comparable. Meanwhile, the performance of LNA type 3 is the worst.
Not only have the least satellite in view which can be tracked, but also the average C/N0 obtained from signal using the LNA type 3 is lower around 10dB-Hz than the other LNA type 1 and type 2.
The lower C/N0 of LNA type 3 is partly due to lower gain compared to the other LNAs, but also the noise introduced by LNA type 3 to the signals.
The effect of low C/N0 quality of LNA type 3 causes the estimated position has high dilution of precision (DOP) and also requires three-time longer time to have a position fixed compared to the other LNAs.

The noise of various LNAs
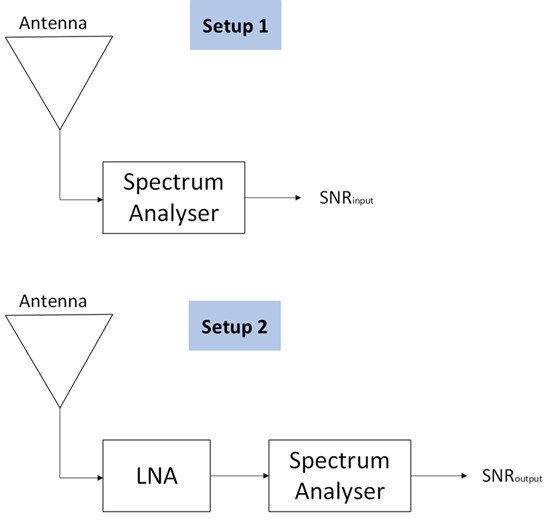
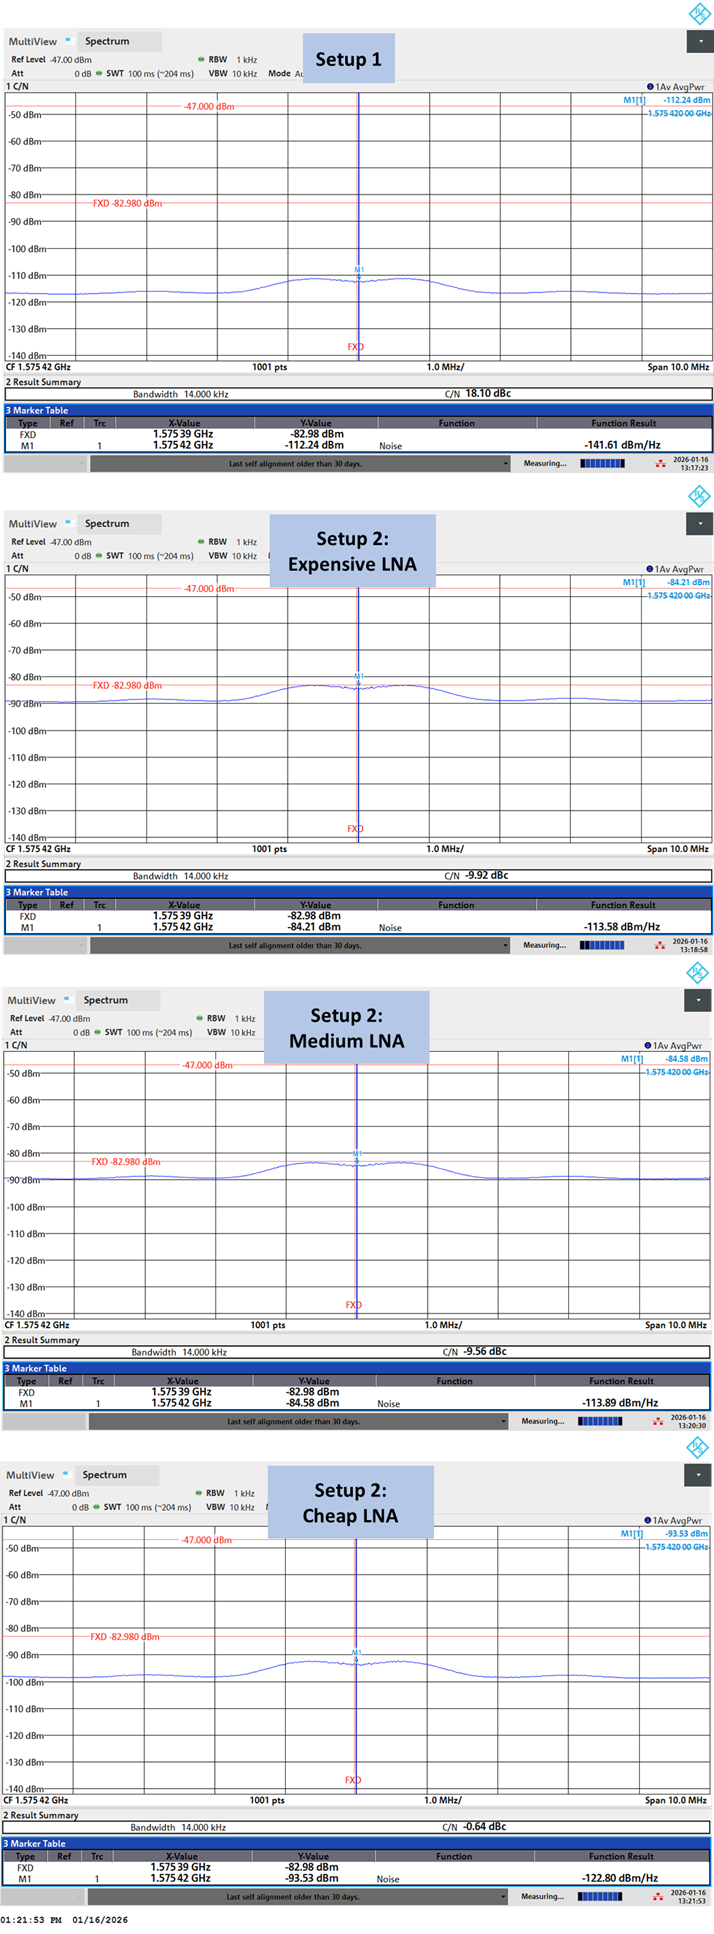
To quantify the noise of the three LNAs, we use the typical setups shown in figure 3 below. We will need a spectrum analyser for this experiment.
In figure 3, there are two setups: setup 1 and setup 2.
Setup 1 is where there is no LNA in the RF chain. The signal-to-noise ratio (SNR) measured from setup 1 is called “SNR input”. Meanwhile, setup 2 introduces the LNAs in the RF chain.
Note that, we don’t need the R&R device in this setup, we just need the GNSS antenna, the LNAs under test and the spectrum analyser.
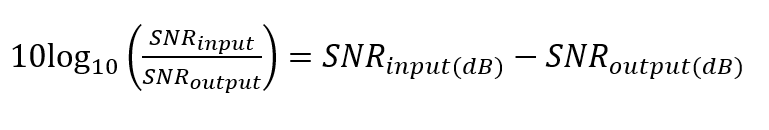
The noise figure (NF) of the LNAs is measured following this equation:
The results of the test measuring the SNR input and SNR output to estimate the NF for each LNA are presented in figure 4 below.
From figure 4, we can quantify the SNR input as well as the NF for the LNAs as follows:
- The SNR input obtained from setup 1 is ~18.1dB.
- The SNR output for LNA type 1 is ~9.92dB. Hence the NF = 18.1 - (9.92) = ~8.18dB.
- The SNR output for LNA type 2 is ~9.92dB. Hence the NF = 18.1 - (9.56) ~8.54dB.
- The SNR output for LNA type 3 is ~0.64dB. Hence the NF = 18.1 – (0.64) = ~17.46dB.
From the test results, we notice that the LNA type 3 has the largest NF of ~17.4dB compared to LNA type 1 and type 2.
Meanwhile, LNA type 2 has a comparable NF with respect to the LNA type 1.
From this test, as expected the LNA type 3 has higher noise as well as not as high gain compared to LNA type 1 and type 2 and hence has the worst signal quality.
READ MORE: Beware of reading signal-to-noise ratio (SNR) from power spectral density (PSD) plot
Conclusion
In this post, we show the performance comparison of three LNAs, from expensive, medium to cheap LNAs.
From this comparison, although the cheap LNA can provide a position, the quality of the solution is the worst compared to the other LNAs. Also, the C/N0 of signals using the cheap LNA is lower around 10dB-Hz compared to the expensive and medium LNAs.
From this comparison, user can get benefit that there is a trade-off between the LNA price and their qualities however, there is an optimum price for an LNA that can still give comparable quality with expensive LNAs.
Reference
[1] Golio, M. and Golio, J. eds., 2018. RF and microwave passive and active technologies. CRC press.
You may find some interesting items by shopping here.