Quick RF signal quality test: Passive RF splitter/combiner loss and noise
This post will quickly discuss how we can test the loss and noises of a passive device splitter/combiner of RF signals.
This post will quickly discuss how we can test the loss and noises of a passive device splitter/combiner of RF signals.
Passive splitter/combiner is a common device used in many setups of RF chain, including GNSS receiver RF chains.
Since passive devices induce power loss and noise on RF signals, we may have some degradations on our results when we process the signals.
In some situations, these signal quality degradations may be insignificant. However, very often, the degradation may lead to unacceptable results after processing the signals.
Unacceptable results in GNSS may be, for example, loss of many satellites in view, very low C/N0 values and high dilution of precision (DOP) as well as a reduction in positioning accuracy.
In the next section, although power loss and noise of a passive device are stated in its datasheet, in real situations, we want to budget the actual power loss and noise in our RF chain setup.
We will quickly discuss the common and quick method to quantifying the loss and noise of a passive splitter/combiner.
READ MORE: TUTORIAL on how to measure RF receiver noise: A practical approach
RF splitter/combiner power loss and noise
In data sheet, the power loss and noise of a passive device are stated as ranged values. This range value is because the power loss and noise of a passive device are frequency dependent [1].
These two properties are frequency dependent due to variation of insertion loss and impedance mismatch induced by signals at different frequencies. Although, the thermal noise from passive devices is frequency dependent.
Insertion loss is caused by the effect of material absorption, skin effect and conductor loss at different frequencies. The higher the frequency the higher the insertion loss and hence the device noise.
Meanwhile, impedance mismatch is like the resistance for A/C signals, including A/C currents and RF signals. The difference with the resistance of DC current is impedance include both resistance and frequency dependent due to phase-shift effect.
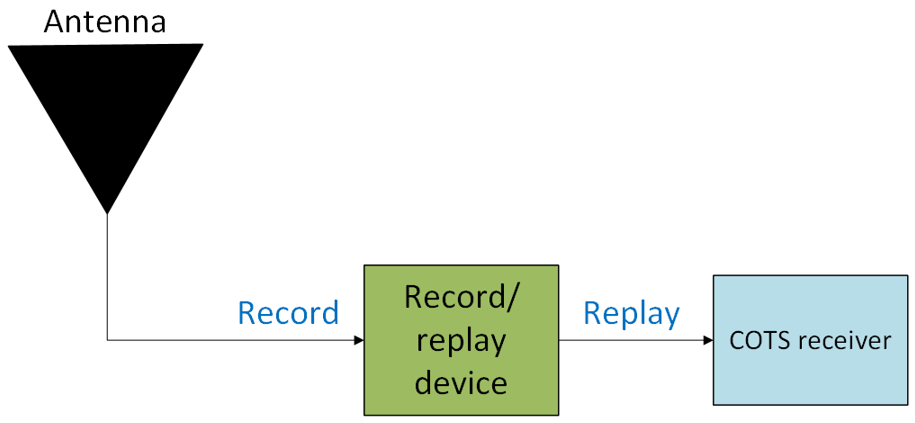
In this case, we will analyse the signal power loss and noise on a record and replay device (R&R device) RF chain. We will see the effect of power loss and noise is obvious on the replied signal from the R&R device.
The R&R device contains several passive spitter/combiner inside its system.
Figure 1 below shows the basic setup of the R&R device. From this setup, we record GNSS signals and process the signals to see the effect of signal degradations due to passive devices.
The signal is processes by using a COTS GNSS receiver. From this COTS receiver, we can extract the tracked C/N0 from acquired satellite in view.
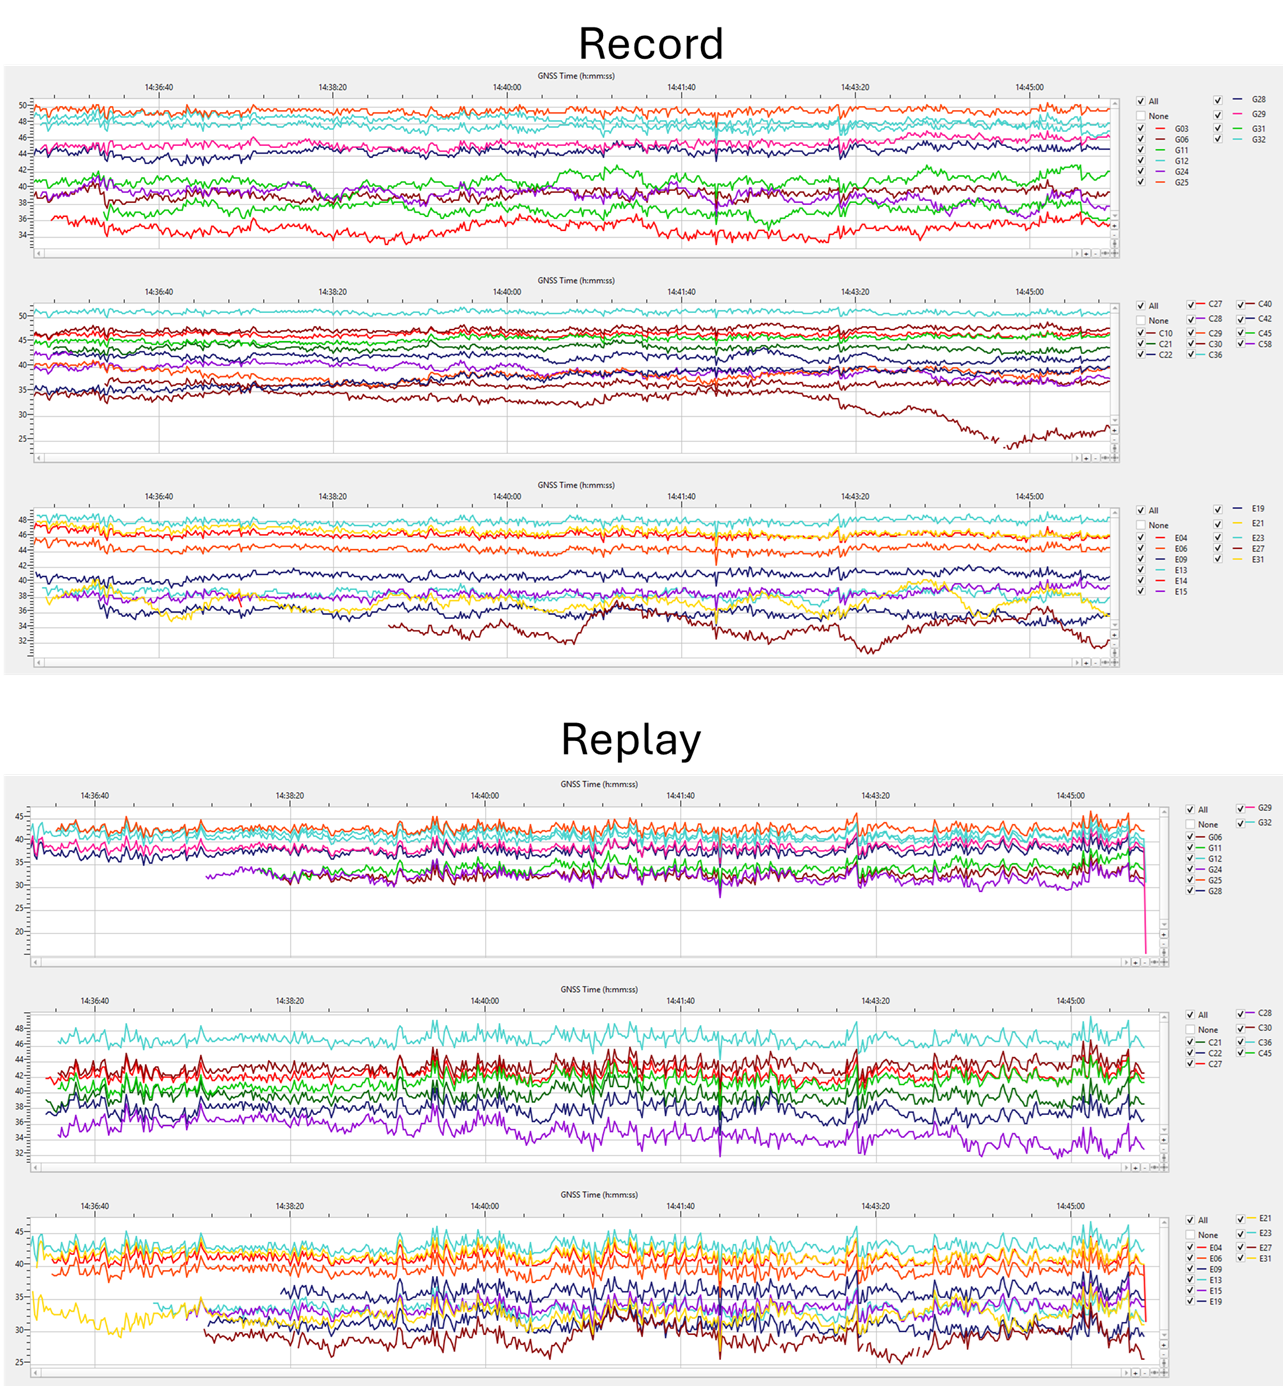
Effect of signal power loss and noise
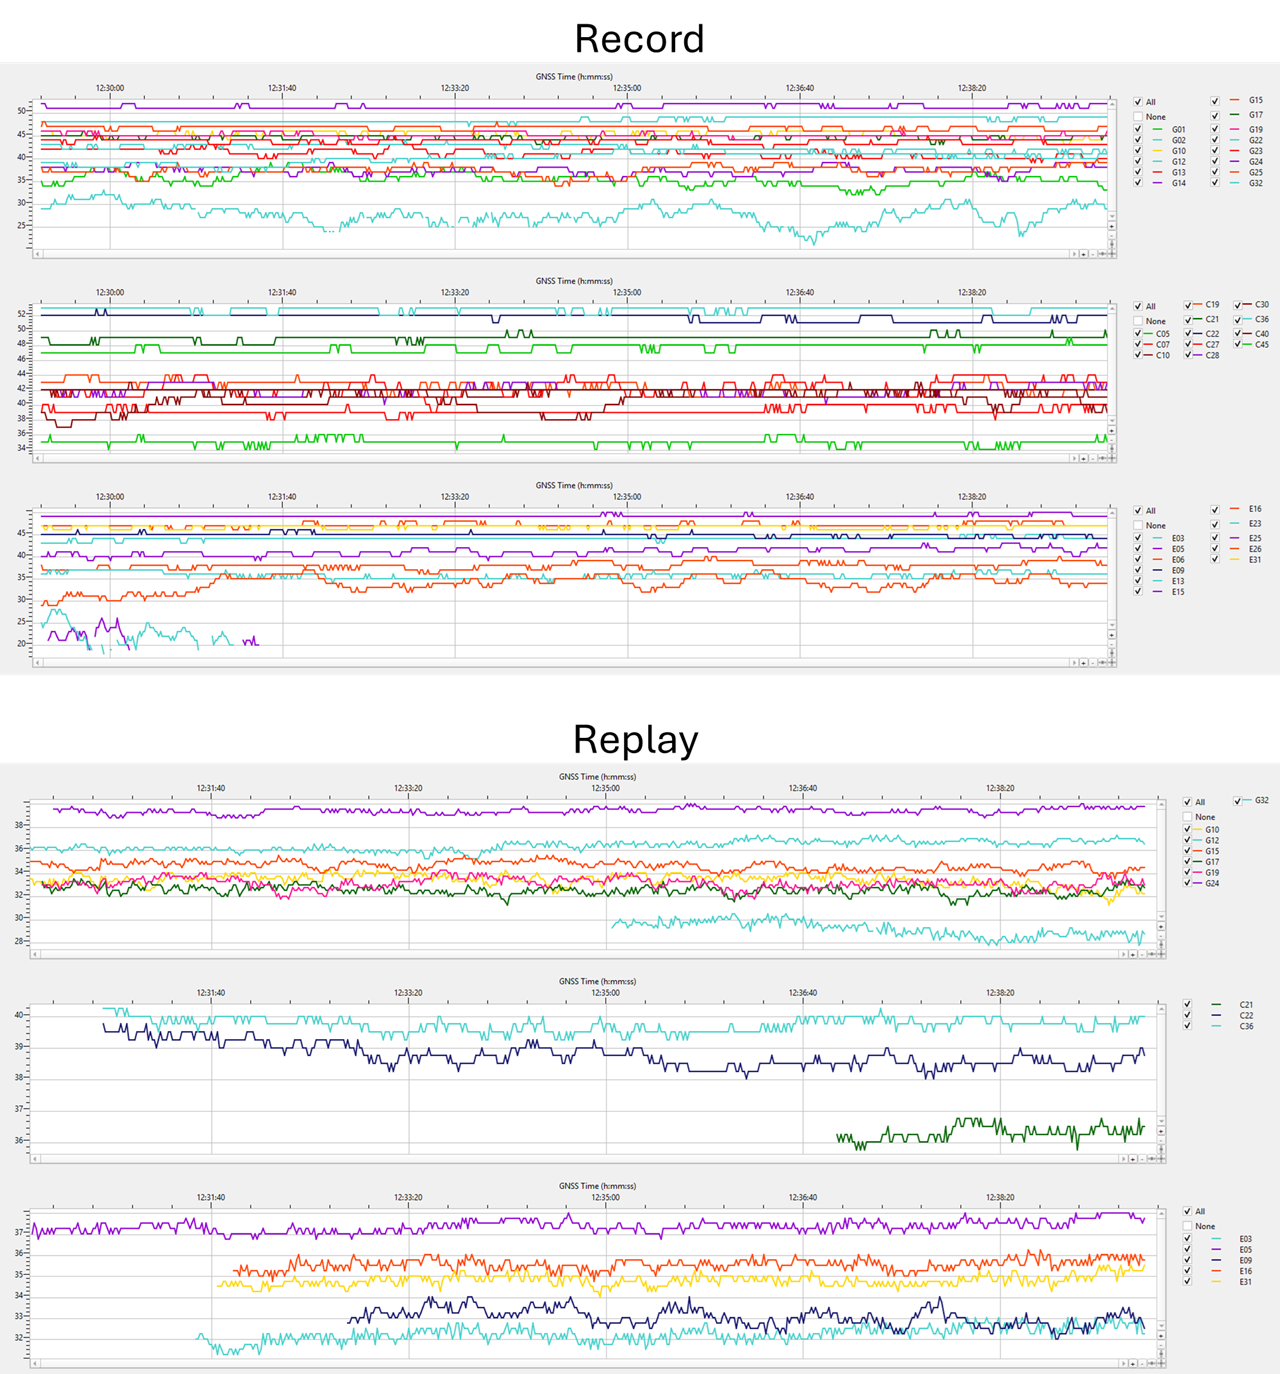
Given the setup in figure 1, GNSS signals are recorded for a period of time. The recorded signals are then processed by the COTS receiver.
Figure 2 below shows the C/N0 calculated from tracked satellites in view extracted from recorded and replayed signal.
Record signals mean that the signal captured directly from the antenna instead of passing through the R&R device.
From figure 2, not only the averaged C/N0 of replayed signals is 8dB-Hz lower than the recorded signal, but also >50% satellite in view cannot be acquired and tracked from the replayed signal.
This results obviously show the pronounce effect of signal power loss and noise of the replayed signal due to the passive devices inside the R&R device.
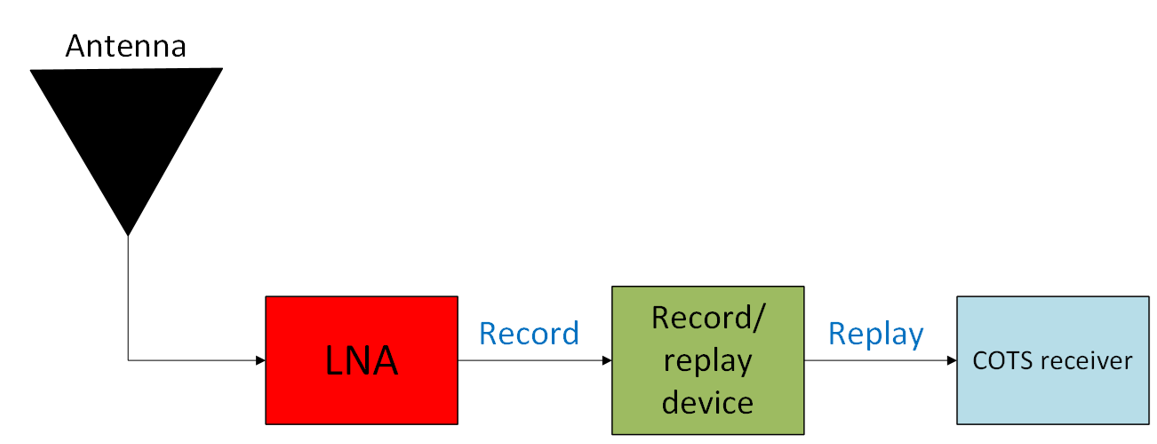
To address the above problems, we than add a LNA (low noise amplifier) into the RF chain setup as shown in figure 3 below.
In figure 3, we place the LNA between the GNSS antenna and the R&R device to increase the signal power while adding minimal noise to the signal.
After adding the LNA, we then recapture GNSS signals and process them by using the COTS receiver.
The results are we can get comparable C/N0 and number of tracked satellites in view as shown in figure 4 below.
The next observation on figure 4 is the C/N0, although acceptable at this point, of the replayed signal has higher variation than the recorded signal.
This high variation on C/N0 is mainly caused by the additional noise from the passive splitter/combiners inside the R&R device.
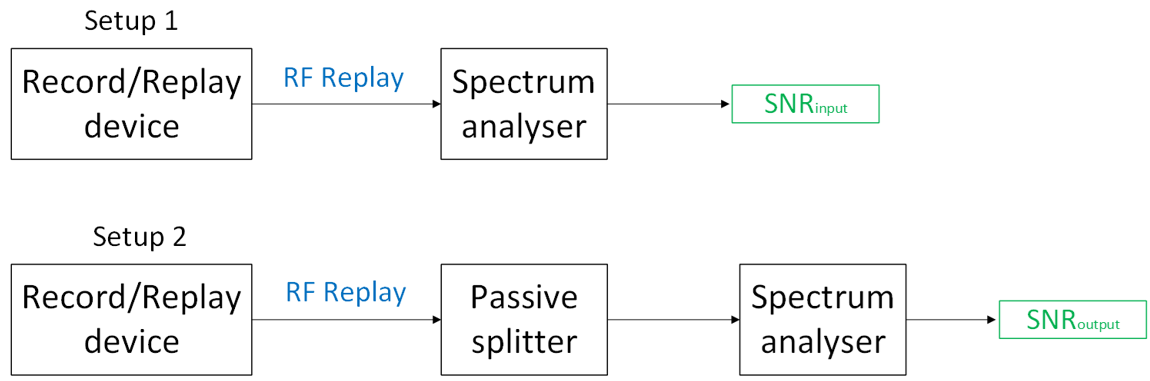
Quantifying the power loss and noise of a passive splitter/combiner device
In this section, we will quickly discuss the typical setup to quantify the power loss and noise of a passive splitter/combiner.
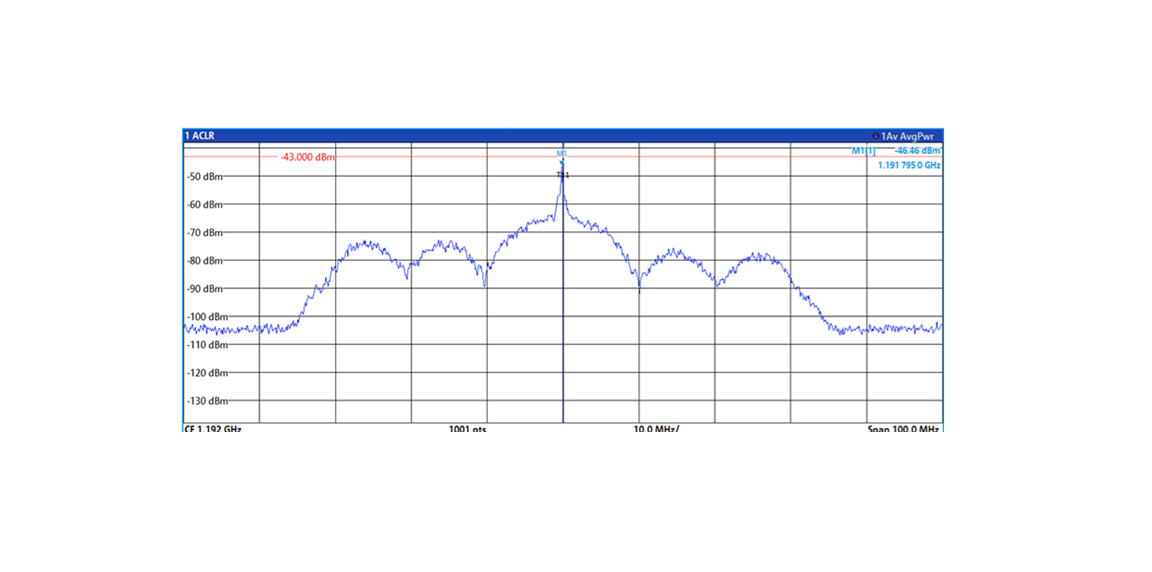
Figure 5 below shows the typical setup. In figure 5, the setup requires a spectrum analyser and contain two configurations: with and without the passive device we want to quantify the power loss and noise.
The spectrum analyser can present the spectrum of the replayed signal as well as measure the property of the signal, such as signal-to-noise ratio (SNR).
Note that, the output from setup 1 is “SNR input” and the output from setup 2 is “SNR output”. These outputs will be used for determining the noise figure (NF) of the passive device.
Power loss
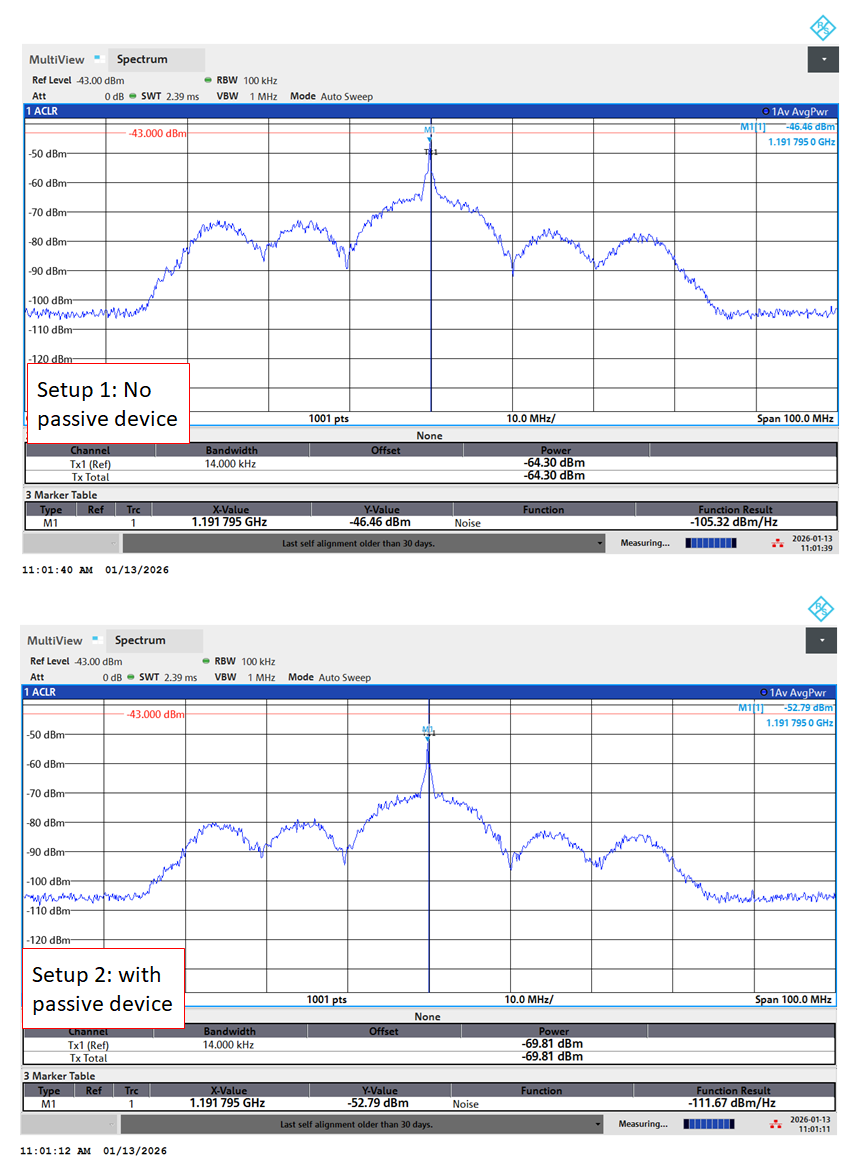
The actual power loss of the passive splitter is calculated by the measured power read from setup 1 (the RF chain without the passive slitter) minus the measured power from setup 2 with the passive splitter (see figure 5 above).
Figure 6 below shows the reading of the measured signal power from both setup 1 and setup 2. From these measurements, the total power loss of the passive splitter is (69.81-64.3)dBm = ~5.51dBm.
Noise
Noise introduced by the passive splitter contribute to the variations of the estimated C/N0 shown in figure 4 above.
With the two setups shown in figure 5 above, we can also quantify the noise induced by the passive splitter.
For this test, an identical simulated signal is transmitted from the R&R device to the spectrum analyser.
The simulated signal is a simple single PRN BPSK signal with Gaussian filter instead of rectangular (removing multiple lobes) on the spectrum.
By using the spectrum analyser, the SNR input (setup 1) and SNR output (setup 2) are measured.
The noise figure (NF) is calculated as:
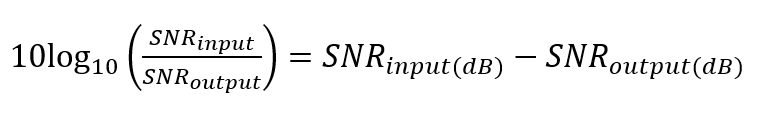
Figure 7 below shows the results of the SNR input and SNR output measurements.
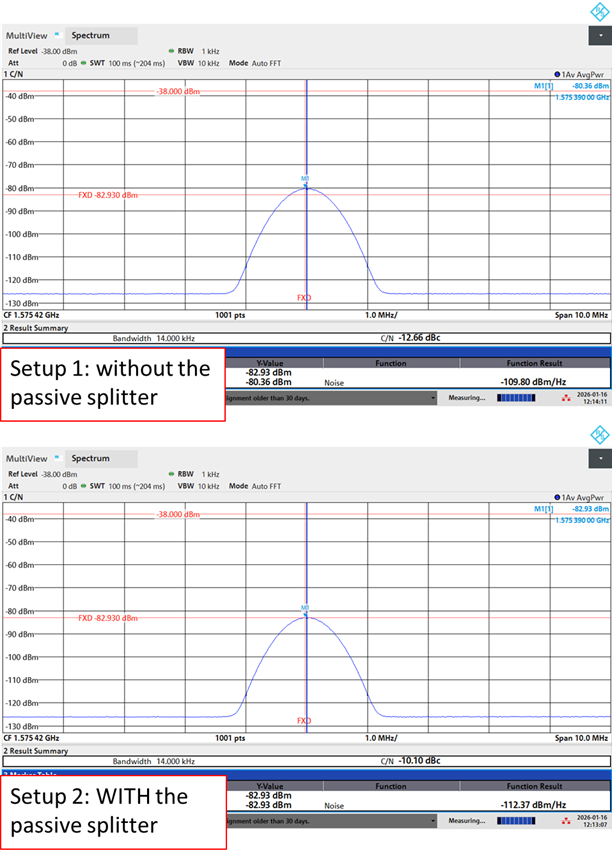
The results of the SNR measurements from setup 1 (SNR input) and from setup 2 (SNR output) are 12.66dB and 10.1 dB, respectively.
Hence, based on the formula in (eq. 1), the NF of the passive splitter is about 2.6dB.
READ MORE: Beware of reading signal-to-noise ratio (SNR) from power spectral density (PSD) plot
Conclusion
In this post, we have discussed the effect of power loss and noise induced by a passive splitter. In addition, we also present typical quick test setups we can use to quantify both the power loss and noise of a passive splitter.
The test setups require the use of a spectrum analyser as we want to measure the power and SNR of replayed signals with different RF chain configurations.
In conclusion, passive devices introduce power loss that may degrade our GNSS signal processing. Besides, power loss, a passive device also introduce noise to the signal that may cause variation on estimated C/N0 of processed signals.
Reference
[1] Golio, M. and Golio, J. eds., 2018. RF and microwave passive and active technologies. CRC press.
You may find some interesting items by shopping here.