Research as value and economy creation activities
In this post, we will discuss how to estimate the value (in cash) that can be generated from a research activity. In finance, cash is king!
In this post, we will discuss how to estimate the value (in cash) that can be generated from a research activity. In finance, cash is king!
we will discuss research as a profit-generation activity. That is, research is an activity to create values and to improve the economy as a whole.
Net present value and discounted free-cash-flow analysis will be performed to show how research is a value (profit) generation activity [1].
Recently, this free-cash-flow metric of financial analysis of a project or activity or company is the most important method to assess whether a project/activity/company is profitable or not and whether a project/research/company creates values or not.
The fundamental idea is that any research/project/company should create value (in terms of free cash) in order to be profitable and grow!
For continuous growth and creating value, after creating free cash, we must re-invest the free cash to generate other free cash-generating projects/research/companies for a long period of time, and repeat these processes again and again!
How to create value and why research is a value and economy creation activity, Let us deep dive into the discussion!
READ MORE: Is research expensive?

Why cash analysis is important?
In financial analysis, over history, there are different trends of methods that are used to analyse the finances of a company or project [1].
For years, ratio analyses of finance have played an important role as analysis tools. Especially, returns on equity ratio is one of the most famous ratios used. This equity ratio is the main metric in DuPont analysis [2].
The return on equity (ROE) ratio used in DuPont analysis is formulated as:
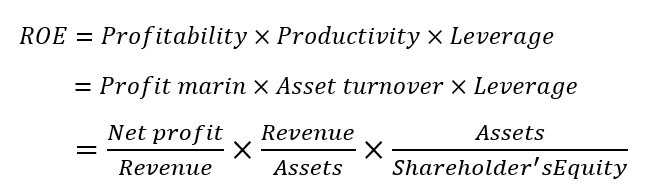
The higher the ROE the better the investment or the value of a company or project. However, only focusing on this single metric may mislead to a wrong conclusion!
If we see the equation above, high ROE can be obtained from high leverage.
Leverage is a debt (used to finance assets, including working capital)!
It means that instead of high profit or high productivity, the company or project has too much debt which of course is not good at all!
On the other hand, ROE can be from high profitability. However, this profitability value can also mislead!
Because, for example, a company or project has a very high profit, but the company or project needs high capital financing. The company/project needs the money to pay their operational and other capital investment. This situation means that the company/project literally cannot use the money from the profit!
It is the same as for someone who has a very high salary, because of some reasons (maybe internal or external), his cost of living is very high so that the salary is not enough for him!
Hence, we need to focus on cash flow analysis, especially free cash flow!
Cash is king and is the real matter that all investors can take back from the money they have invested and put in their pockets!
The analysis of cash is to estimate the future of cash’s value into the present time considering some devaluation of the cash over the years, that is the discount rate!
It is very important a company or project can generate cash to distribute dividends to shareholders and reinvest the money for future growth as well as other beneficial activities.
The evolution of financial analysis: from revenue to free cash flow
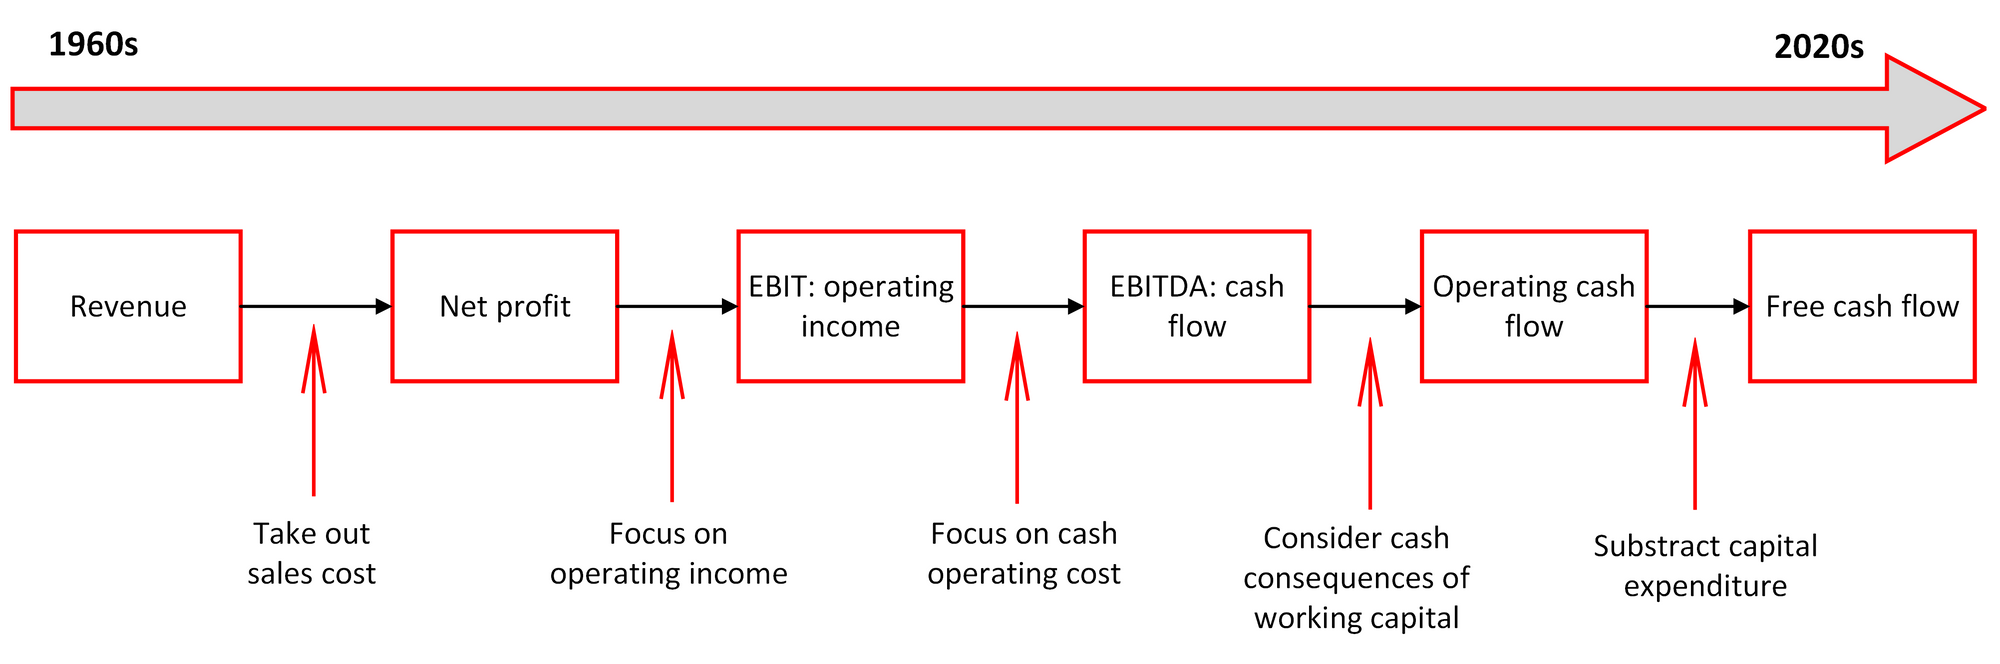
From 1960 to 2020, there are several evolutions of financial analyses that have been used by companies to evaluate their business [1].
Starting in 1960, financial performance is solely measured by revenue(sales revenue) that is still gross. Hence, after taking out sales costs, financial analysis focuses on net profit.
After that, financial analysis shifts to earnings before interest and tax (EBIT) operating income. That is, the analysis focuses on operating costs. From hereafter, the importance of cash starts to receive attention.
The next analysis trend is earning before interest, tax, depreciation and amortization (EBITDA) cash flow. This EBITDA metric focuses on cash operating costs.
Many times, the cash that a company/project generates cannot be used due to some working capital consequences, such as the need to finance their operations. Hence, by incorporating cash consequences of working capital into the calculated EBITDA, the operating cash flow metric is obtained.
Finally, depreciation and amortization (capital expenditure) are not direct expenses (many times are only estimation). Hence, these capital expenditures need to be added back to the operating cash flow to get the estimate of free cash flow.
That is as the name “free” implies, free cash is money that the companies can do for whatever they want.
Figure 1 shows the timeline of the financial evolution. From Figure 1, nowadays, the free cash flow metric is the golden standard metric to measure financial performance.
Overall, from Figure 1, we can see that the financial analysis step-by-step focuses on cash, especially free cash, that is from cash flow (EBITDA), then operating cash flow and then finally free cash flow.
Free cash flow calculation
The free cash flow is calculated as [1]:
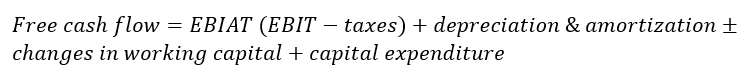
Where EBIT is earning (net profit) before interest and tax and EBIAT is earning before interest after tax.
For clarity, Figure 2 shows the schematic view of free cash flow calculation. In Figure 2, net assets, containing working capital and fixed assets, will generate EBIAT. Then, the EBIAT is subtracted by investments for both working capital (operation) and fixed assets (capital expenditures).
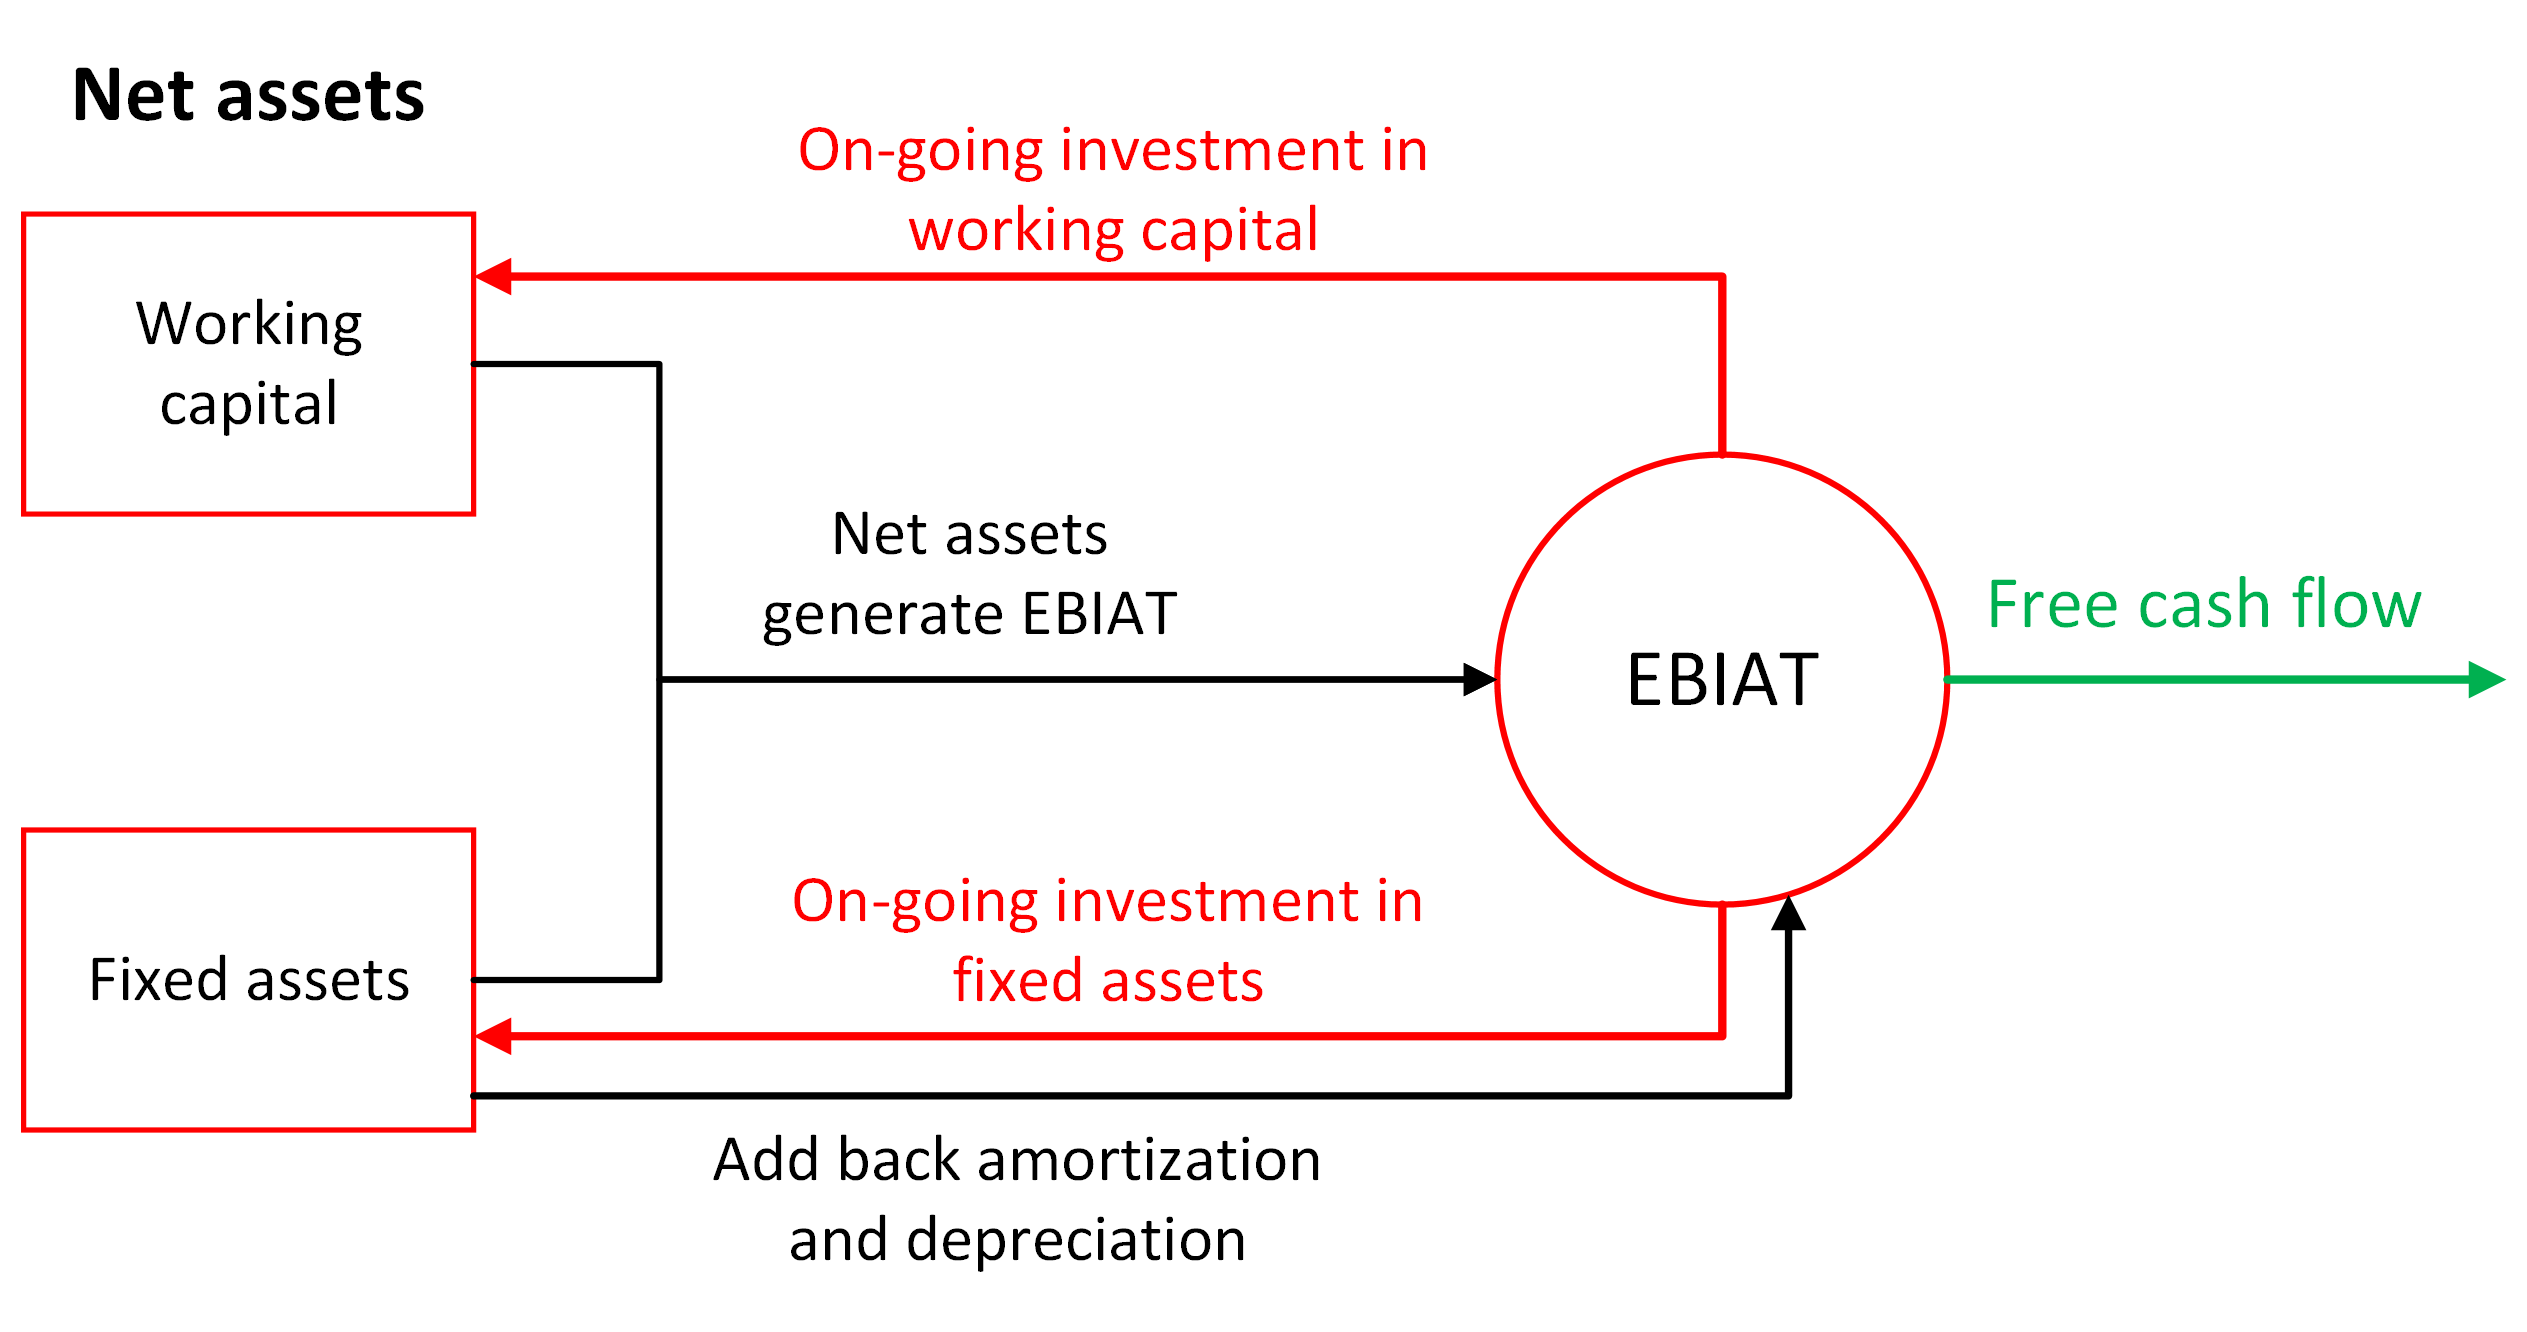
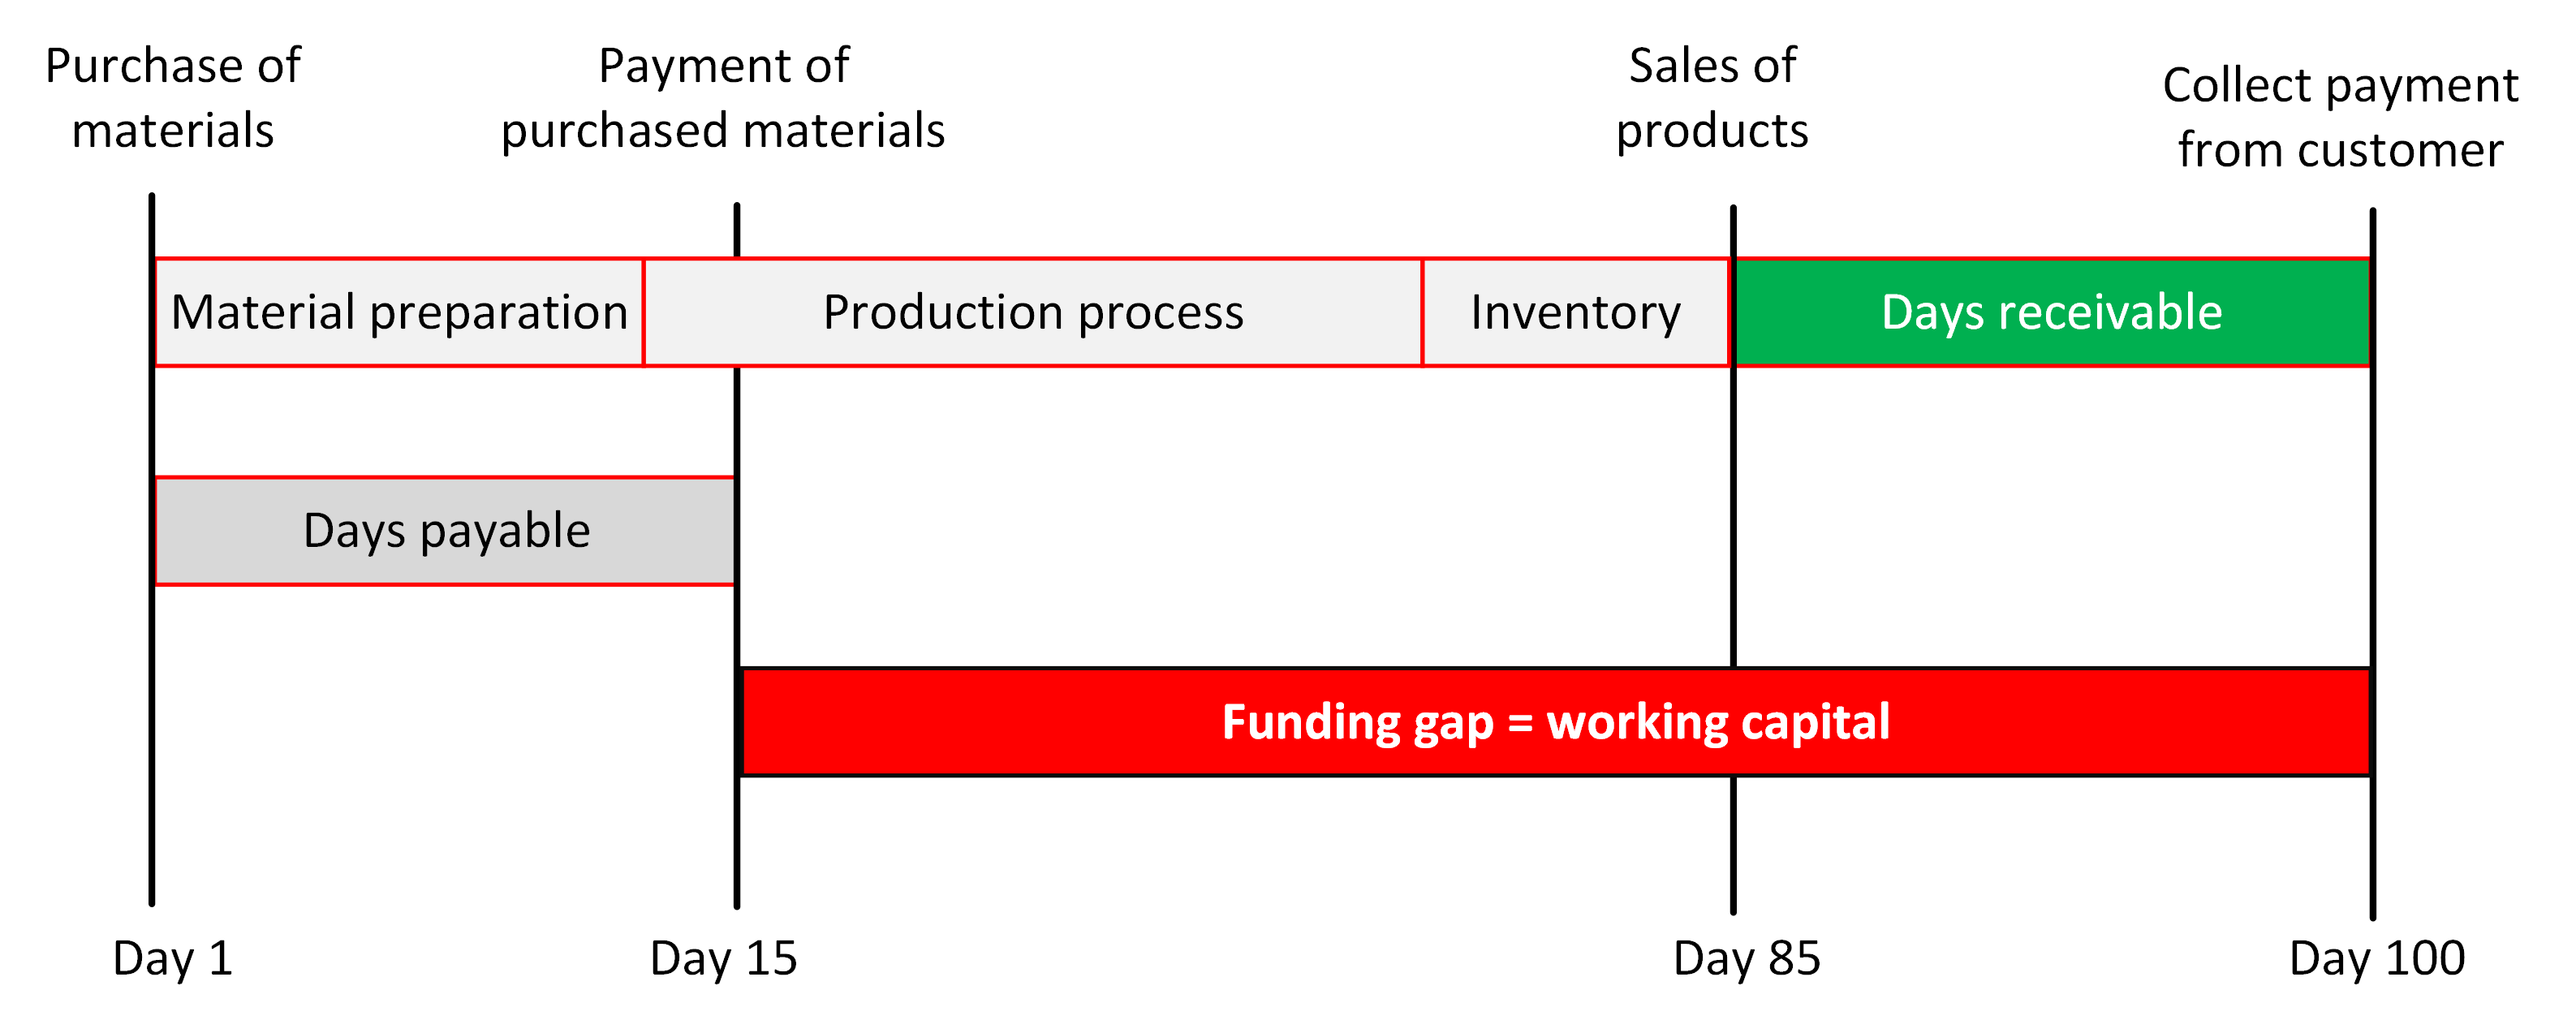
Figure 3 presents the meaning of working capital or “funding gap”. Working capital is the money required to continue the operation and/or growth of a company or project.
As can be seen in Figure 3, in the case of a production company, the funding gap is the days between when the company can collect the payment from customers and when the company needs to pay for their material purchases. In this case, the funding gap is $100-15=85$ days!
Hence, for 85 days, the company should find money to fund their operation!
Finally, to conclude this section, the higher the free cash flow, the better the company or project! This conclusion is always true without any ambiguities or misleading conclusions like the DuPont analysis explained above.
READ MORE: Simplicity is the ultimate sophistication: The use of simple rules for successful research
Net-present value (NPV) and discounted cash flow
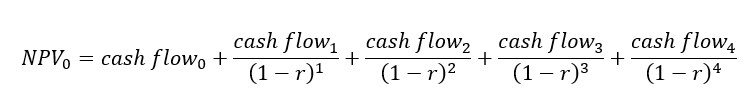
The NPV of any investment is defined as the sum of current and future cash flows discounted back to the present using an appropriate discount rate. NPV tries to estimate the future value (cash) of a project into the value at the current or present time.
The NPV is calculated as follow (in this example for up to 4 years future value) [1]:
Next, discounted cash flow analysis is derived from the NPV analysis.
Discounted cash-flows
The discounted cash-flow is calculated as follow [1]:

Where “cash flow” here means “free cash flow” and $r$ is the discount rate. that is, $r$ is the cost of capital.
Remember, “free cash flow” means the flow or result generated by assets that are truly free and truly cash.
From the above both NPV and discounted cash flow formulas, we can see that a project or activity or company is considered profitable, that is creating value, when the NPV or present value of the project/activity/company is positive.
That is, positive NPV or present value means that the project/activity/company can “beat” their cost of capital $r$.
Cost of capital
The cost of capital $r$ consisted of the cost of liability (debt) and the cost of equity. This cost is the one we need to beat so that we can get positive NPV or present value and hence create profit (in terms of real free cash flow).
Examples of costs of debt are interest, tax and others. Meanwhile, the examples of cost of equity are investor’s expected return and market volatility.
To combine both the cost of debt and the cost of equity, a weighted-average summation method is used.
The weighted-average cost of capital (WACC) $r_{WACC}$ is calculated as [1]:
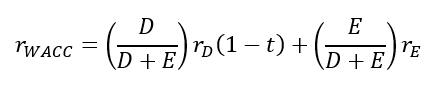
Where:
$r_{E}=$ cost of equity
$r_{D}=$ cost of debt
$E=$ market value of the firm’s or project’s equity
$D=$ market value of the firm’s or project’s debt
$D+E=$ total market value of the firm’s or project’s financing (equity and debt). In other name, it is the capital structure[1] of the firm or project.
$t=$ tax, such as corporate tax
The tricky one is to determine the cost of equity $r_{E}$. To determine this $r_{E}$, a model called capital asset pricing model (CAPM) is used as is calculated as [1]:
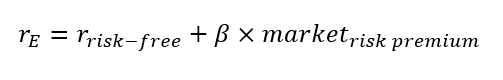
Where:
$r_{E}=$ cost of equity
$\beta =$ a constant that measures of how stocks move with the market [1]. For example, if $\beta = 1$, then if the market goes up by 5%, then the stock also goes up by 5%.
$r_{risk-free} =$ risk-free rate, for example, investor’s expected return
$market_{risk premium} = $ is the risk of market volatility that cannot be diversified anymore (systematic risk) [1].
For details on how to determine the cost of debt $r_{D}$ and cost of equity $r_{E}$ as well as $\beta$ and $market_{risk premium}$, readers can refer to [1].
That is, for a project or company to grow and be considered profitable, they must create value!
Three ways of creating value are by [1]:
- beating the cost of capital (positive NPV project)
- doing it for a long time and
- reinvesting profits as much as possible for growth (creating new positive NPV projects)
READ MORE: Is research expensive?
NPV and Discounted cash-flow analysis for research activity
In this section, we will answer the question of how we can estimate the cash that can be generated by a research activity.
In this section, we will use a hypothetical case study that is as simple as possible. The main purpose is to show the idea of NPV or discounted cash flow analysis to estimate the value that research activities can generate.
Remember, the “value” here is measured as “free cash”. Because the “free cash” measure is a clear and non ambiguous number. The more “free cash” we have the better the finance means. This conclusion is absolute!
Hence, the main purpose of this case study is to show how much “free cash” research can generate.
The assumption
Before performing the NPV analysis, several assumptions are prepared. These assumptions are an art but should be informed by science. The currency is in pound sterling.
In this case study, suppose we have one researcher to perform a 10-year research project. The source of funding is purely from equity (let's say a government) and no borrowing.
The assumptions are:
- Tax rate = 20% from the EBIT
- Working capital, as the required money to fund the research activity, includes researcher salary per year = £45k and Research consumables per year = £2k, lab maintenance per year = £2k, salary yearly increase = 5%
- Capital expenditure (once in Year 0) to purchase equipment = £50k
- Inflation as the cost of debt component = 3%
- Expected return as the cost of equity [3,4] = 25%
- The ratio between debt (D) and equity (E) is 50:50
The discount rate $r_{WACC}$ is the total cost of capital. Based on the inflation, expected return and D/E ratio above, the calculated $r_{WACC}$ is approximately 10%.
Hence the NPV calculation is as follows:
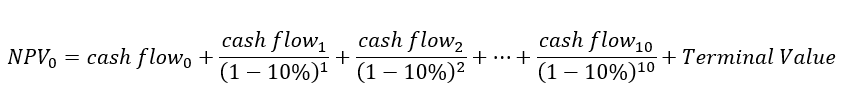
Figure 4 shows the results of the NPV analysis. The present value for each year is calculated as free cash flow multiplied by the discount factor. As can be seen from Figure 4, during the research period, EBIT is zero since there is no income from the research activity.
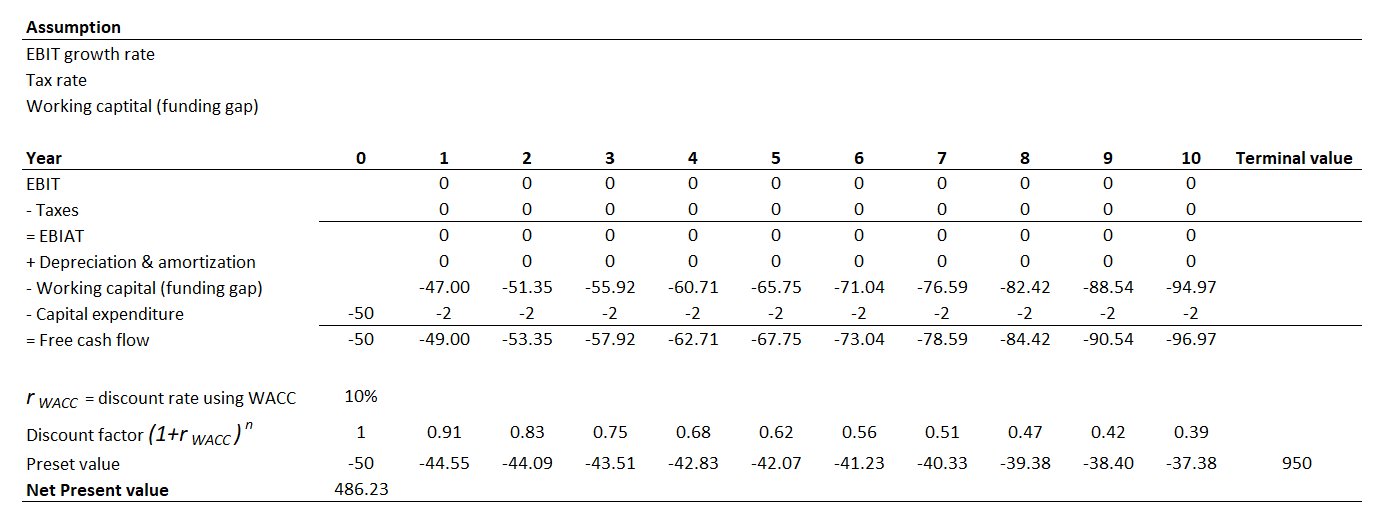
From Figure 4, we assume that every 1£ will generate at least 2£. In many cases, it can generate multiple folds of the investment or even more!
Of course, the direction and type of research should be considered carefully so that the research outputs can contribute to generating products or improving processes.
Many proofs have been shown in many leading countries where their research results can be converted into a scaled-up product that creates multiple folds of free cash (values).
That is, the terminal value is double (assuming 1£ can generate 2£) of what has been invested. From the NPV analysis, it can be shown that around positive £486k of free cash can be generated after the end of the research activity.
This positive free cash always means profitable without any ambiguity or misleading understanding of the real finance situation as may occur with another metric!
For discounted cash-flow analysis (figure 4), we just need to take out the year 0 number. Hence, the discounted cash flow is added by 50 into about £536k of free cash generated.
There are at least two important notes from the NPV calculations sheets shown in Figure 4, that are:
- The assumption of terminal value to be at least 2 or more times than the expenses may not apply for all research activities (some of them may have terminal value < 2 times or even less). However, in many cases, one successful research can have multi-folded terminal values and can pay back all the expenses of other research activities.
- From the present value calculations over time, the "real value" of the expenses is reduced over time due to the cost of capital (the degradation of the cash value over time)!
The main thing to remember is that this valuation is an art informed by sciences. Hence, it will directly be affected by our assumptions. But, our assumption should be based on data and science so that the assumptions are reliable.
READ MORE: Research is like a puzzle: Start from anywhere to reach a goal
Conclusion
In conclusion, research is a real activity that can create significant value (in terms of free cash) and hence profit for economic growth. Only by research, a knowledge-based economy, which has been the reason for developed countries to be as they are, can be generated by a nation.
In this post, NPV and discounted free cash-flow analysis are used to present research as an activity with a positive net present value (NPV). Hence, research is creating value (free cash) and hence grows the economy!
Finally, the three fundamental concepts for economic growth by creating values are performing projects with the positive present value of free cash, re-investing the generated free cash to other new cash-generating activities and then doing this re-investment for a long period of time.
Reference
[1] Desai, M., 2019. “How finance works: The HBR guide to thinking smart about the numbers”. Harvard Business Press.
[2] Soliman, M.T., 2008. “The use of DuPont analysis by market participants”. The accounting review, 83(3), pp.823-853.
[3] Frontier economics 2014. “Rates of return to investment in science and innovation”. The department of business, innovation and skills.
[4] Every £1 invested in medical research returns 25p per year, forever. Brunnel University London. Link: https://www.brunel.ac.uk/news-and-events/news/articles/Every-1-invested-in-medical-research-returns-25p-per-year-forever#:~:text=A%20new%20study%20from%20Brunel,year%2C%20every%20year%2C%20forever.
You may find some interesting items by shopping here.