Standard deviation and standard error: The fundamental and important differences
In statistical data analysis, the spread of data is mostly quantified with standard deviation. However, for scientific analysis, standard error (SE) (commonly also called, standard deviation of the mean) is more appropriate to use than standard deviation.
In statistical data analysis, the spread of data is mostly quantified with standard deviation. However, for scientific analysis, standard error (SE) (commonly also called, standard deviation of the mean) is more appropriate to use than standard deviation.
Standard error is different with standard deviation. Type A uncertainty, based on GUM, is also calculated as standard error.
There are two main reasons why standard error is used:
- The number of data from experiment is usually not many, for example, maybe three, five or ten data
- The standard error also considers the number of data used to calculate the spread of the data.
For example, if there are two measurements from identical experiments: one measurement is repeated three times and the other one is repeated ten times. Hence, the spread of data from the measurement with ten repetitions will be smaller than the spread of data from the measurement with three repetitions.
Let us go to the details with examples!
The difference between standard error and standard deviation with an example
Let us discuss in more detail with an example.
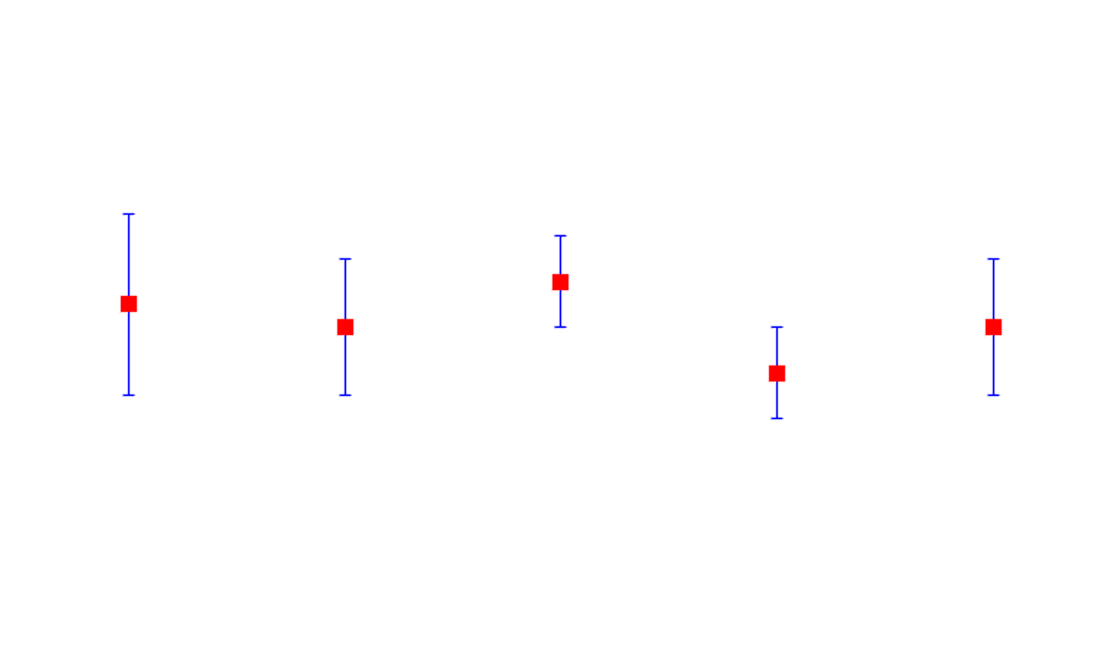
In this example, a measurement of the diameter $D$ of a cylinder with a Vernier Calliper is presented.
If the measurement is repeated with different orientations (carried out by rotating the cylinder to different orientations), hence different diameter measurement results will be obtained.
These different values are due to the measured cylinder is not perfect, there are some defects on the geometry of the cylinder. The defects can be from the manufacturing process of the cylinder and the measurement error.
Each measurement result of the cylinder diameter is notated as $d_{i}$, the mean value from $n$ numbers of independent measurements of the diameter $D$ is $ \overline{d}$. The assumption of the data is that the data follow normal distribution.
Table 1 shows the example of measurement results with number of measurements $n=5$.
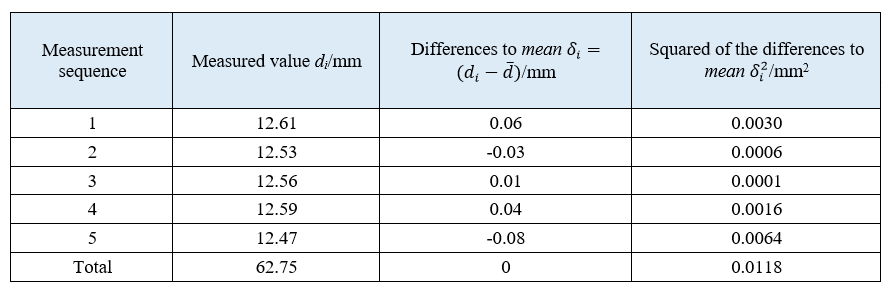
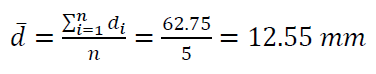
From the measurement results shown in table 1, the mean value $\overline{d}$ from the measured diameter $d_{i}$ with the number of measurements $n=5$ is (assuming normal distribution):
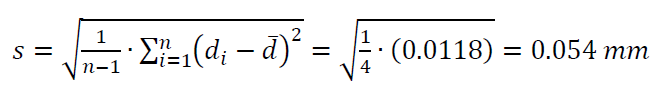
Standard deviation $\sigma$ is the standard deviation from infinite numbers of measurement results or from a very large numbers of measurement results.
The value of $\sigma$ is then can be estimated as $S$, that is the standard deviation from a limited numbers of measurement results $S$.
$S$ is calculated as:
The results of the mean $\overline{d}$ is the approximation of the true diameter $D$ and the value $S$ is the approximation of the standard deviation of the population $\sigma$.
The results from the calculation of the mean and standard deviation describe the measurement result of the cylinder diameter with the true diameter of $D$.
However, due to various errors during manufacturing processes, the produced cylinder is not perfect and the cylinder has a deviation from the true diameter value $D$.
The spread of the deviation from $D$ is characterised with $S$. Meanwhile, the approximation of $D$ is $d_{i}$. Hence, the standard deviation $\sigma$ (from the population) is the measure of the deviation of $d_{i}$ from the true diameter value $D$.
However, in this case, the mean diameter $\overline{d}$ is a more suitable parameter to approximate the true diameter $D$ for each measured diameter $d_{i}$.
The parameter that characterises the dispersion or spread of $\overline{d}$ is $S_{m}$.
$S_{m}$ is the standard error (standard deviation of the mean) that is the approximation of the standard error (standard deviation of the mean) from the population $\sigma _{m}$.
Standard error $S_{m}$ is generally used to represent the dispersion or spread from measurement results. This standard error is the one that is used for uncertainty Type A calculation.
$S_{m}$ is formulated as:
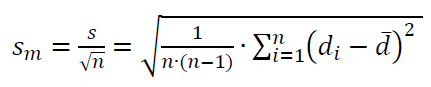
Hence, for the case of the cylinder diameter measurement, the $S_{m}$ is calculated as:
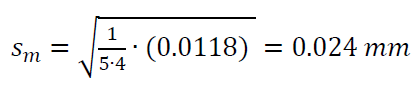
The conclusion from the cylinder diameter measurement example, the value of $S_{m}$ will become smaller if the number of measurement results (the number of measurement data) increases. Meanwhile, the value of $S$ will have similar value even when the number of measurement results (data) increases.
However, although the value of $S_{m}$ can be reduced by increasing the number of measurements, in many real situations, adding more measurements is not efficient.
The reasons that cause measurement addition is not efficient are, for example, due to the significant increase of total measurement time, the increase of required parts to measure and the increase of energy consumption used by measuring machines.
The relation between statistical parameters mean and their approximation method
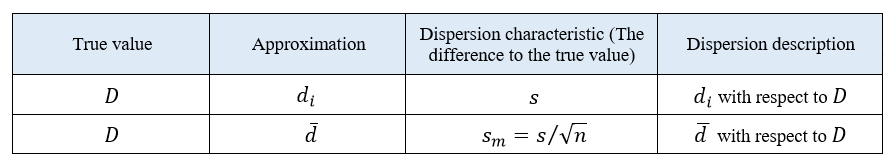
Table 2 shows the summary of the difference property between standard deviation and standard error (standard deviation of the mean).
From table 2, the common standard deviation describes the dispersion of each single measurement $d_{i}$. Meanwhile, the standard error describes the dispersion of the mean $\overline{d}$ that is calculated from many measurements $d_{i}$.
Conclusion
From the given example in this post, we can see the difference between standard deviation and standard error.
Standard error also considers the number of data used to calculate the value of the standard error.
The more measurement data that are available, the least the calculated standard error will be.
Also, based on GUM, type A measurement uncertainty, for all types of measurement results, is calculated as standard error (from the data).
We sell all the source files, EXE file, include and LIB files as well as documentation of ellipse fitting by using C/C++, Qt framework, Eigen and OpenCV libraries in this link.
We sell tutorials (containing PDF files, MATLAB scripts and CAD files) about 3D tolerance stack-up analysis based on statistical method (Monte-Carlo/MC Simulation).