Surface topography measurement: Measurement noise
In this post, we will discuss measurement noise characteristics for optical measuring instruments and some practical procedures on how to estimate the noise.
In this post, we will discuss measurement noise characteristics for optical measuring instruments and some practical procedures on how to estimate the noise.
Measurement noise is one of the metrological characteristics for both stylus (contact) and optical (non-contact) instruments including residual flatness, amplification, linearity, squareness and resolution.
Measurement noise is typically the first metrological characteristics to be at least estimated.
These metrological characteristics (measurement noise and other characteristics) are considered as main contributors to estimate the uncertainty of measurements obtained from stylus and optical measuring instruments [1,2].
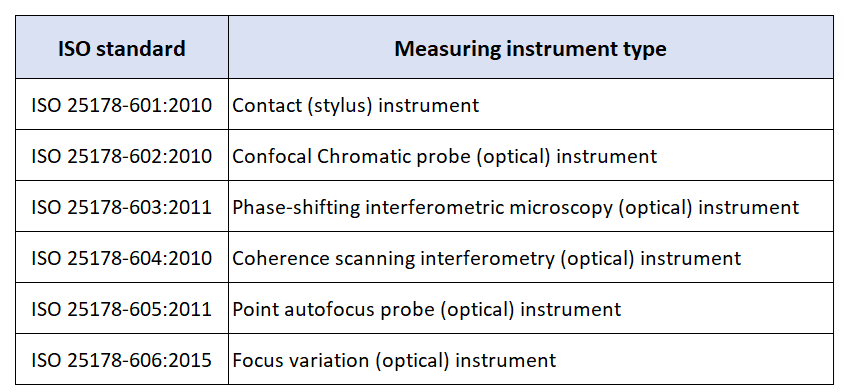
ISO 25178-60X series covers all metrological characteristics for surface topography measurements. Table 1 provide summaries of ISO 25178-60X for each type of surface topography measuring instruments.
READ MORE: Surface topography measurement: Why do we need to measure surfaces?
Measurement Noise
In ISO 25178-60X series, noises are differentiated into two types: instrument noise and measurement noise. Their definitions are as follows [2]:
- Instrument noise: “Internal noise added to the output signal caused by the instrument, if ideally placed in a noise-free environment”.
Internal noise can be due to electronic noise, thermal noise, optical noise and/or amplifier noise. S-filter can contribute to reduce instrument noise.
- Measurement noise: “Noise added to the output signal occurring during the normal use of the instrument”.
Hence, measurement noise includes instrument noise and is the preferred noise consider for the uncertainty contributors.
Important note is that measurement noise is unique in the sense that specific for each type of measurement situations, material of measured parts as well as measurement parameters used to perform a measurement.
Environment disturbances, such as low amplitude vibrations usually from shop floor and temperature variations directly affect measurement noise estimations. The degree of the disturbances’ effects on measured surface topography and hence measurement noise depends on the type of optical measurement methods.
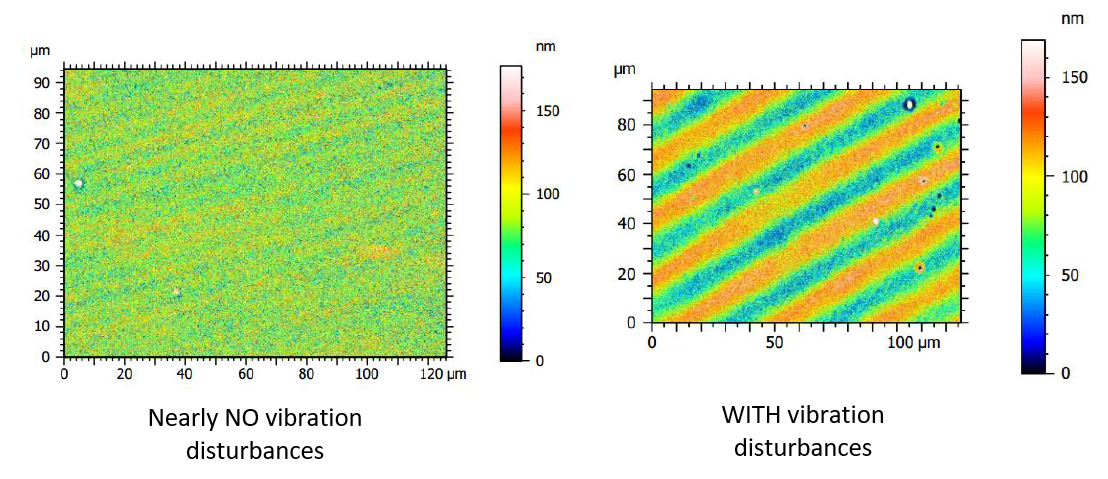
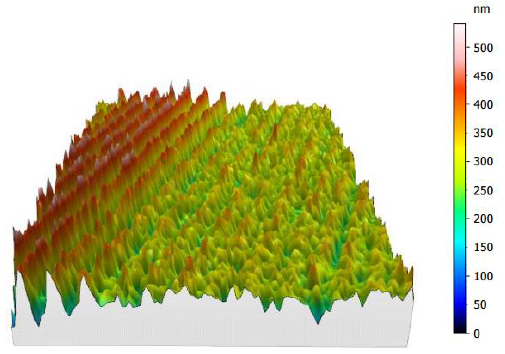
In [3], the significant of environmental vibrations with respect to measured surface topography and hence to measurement noise has been studied. Figure 1 below shows the difference between measured surface topographies nearly without and with vibrations from surroundings.
As seen in figure 3, the surface topography (right) contains periodical features (heights) coming from vibrations compared to the topography (left) when vibrations are very small. In this case, the environmental vibration increases the measurement noise from around 27nm to 36nm, that is an increase of 33% in the noise.
To determine measurement noise, real surface measurements, typically by using an optical flat, need to be performed. Two main methods have been proposed by [4] and has been widely used in industry.
Besides by measuring an optical flat, measurement noise can be determined by using part surfaces that we measure.
The procedure to estimate measurement noise is practical and can be easily performed within a short period of time.
The next section will discuss on how to estimate measurement noise and other properties of measurement noise.
READ MORE: The fundamental concept of metrology
Practical procedure to estimate measurement noise
There are two main methods for estimating the measurement noise of areal surface topography measurement proposed by [4].
Those methods are subtraction and averaging method.
Both subtraction and the averaging methods use Sq parameter of areal surface.
This Sq parameter is the root mean square (RMS) value calculated from the departure of heights of each measured data point from a mean reference plane.
Typical, an optical flat is used to estimate measurement noise. However, in practice, we can also use the part surface that we are measuring as measurement noise is also affected by the properties of the surface we are measuring [6].
Detailed explanations of both methods are as follows:
Averaging method
The averaging method assumes surface measurements are statistically stationary. This stationary property means that noise contributions or values decrease (converge to a lower value) when the number of surfaces, captured at the same location on a surface and the same measurement parameters and used for averaging, increases.
Averaging method is calculated as follows [4]:
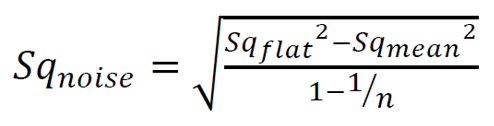
Sq_noise is estimated by calculating the Sq_flat of a single measurement and Sq_mean as the average of several Sq measurements on an optical flat surface or a measured surface.
Non-stationary surfaces have a systematic error on the surface data due to various reasons, such as a large and constant vibration.
An example of effect of non-stationary surface measurements is shown in figure 2. From figure 2, the surface errors on the left side do not decrease after averaging. In this condition, the most suitable method to estimate measurement noise is by using the subtraction method.
Subtraction method
The subtraction method requires performing two repeated measurements in quick consecutive successions.
From these two repeated surface measurements, we subtract one of the surface measurement data with another surface measurement data.
This subtraction method will remove the effect of roughness and the residual flatness error on the subtracted surface measurement data from the noise calculation. Hence, we will isolate and estimate the measurement noise component.
Subtraction method is estimated as follows [4]:
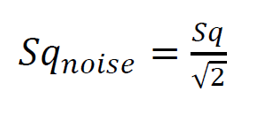
Where Sq is calculated from a subtracted surface measurement data derived from two quick succession surface measurement data.
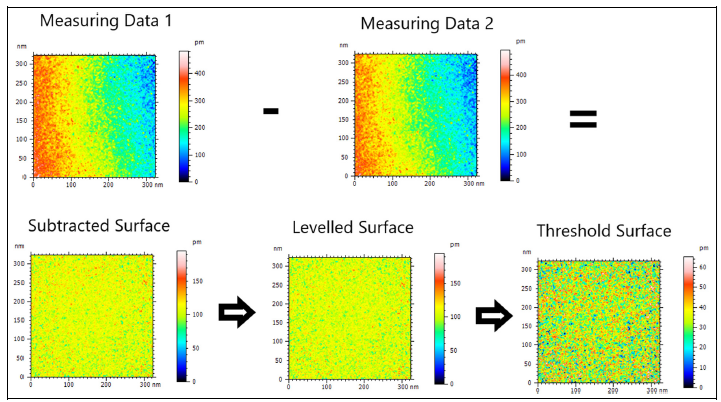
Figure 3 below shows an example of estimating measurement noise with the subtraction method. From this figure, the first step is to subtract two surface measurement data from two quick succession measurements.
After subtracting the surfaces, we applied a mathematical levelling operation to remove the tilt (form component) and make the surface data flat. Hence, we calculate the Sq parameters from the data and estimate the measurement noise (Sq_noise).
We should note that measurement noise is specific to each measurement condition, including measured materials, surface orientation, measurement parameters and environmental conditions. Measuring parameters includes, but not limited to, brightness, scanning speed and vertical as well as lateral resolutions [5].
With different measurement conditions, we need to estimate measurement noise for each specific conditions.
One method is by using a Bayesian learning model that learns measurement noise from a set of conditions to predict the measurement noise for a new condition which is not yet tried before.
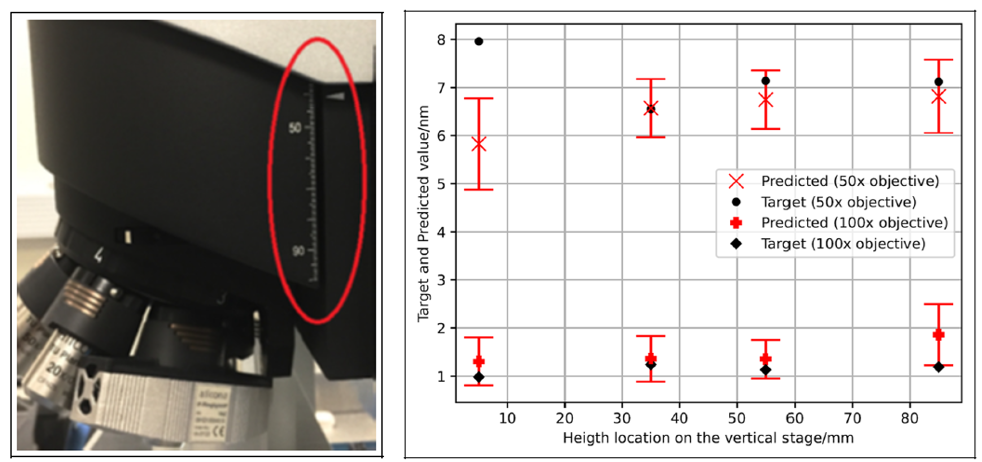
Figure 4 below shows the results of estimating measurement noise of a focus variation microscopy at various measurement parameters by using a Bayesian learning model.
The Bayesian model can predict the measurement noise at various parameters and measurement height location with accuracy of ±1nm except for the lower height as close to the end of motion stage, more motion error occurs due to bearing tensions [5].
In addition, specifically for optical surface topography measuring instruments, the properties of a measured surface, such as colour, and the tilt angle of the surface also affect measurement noise [6].
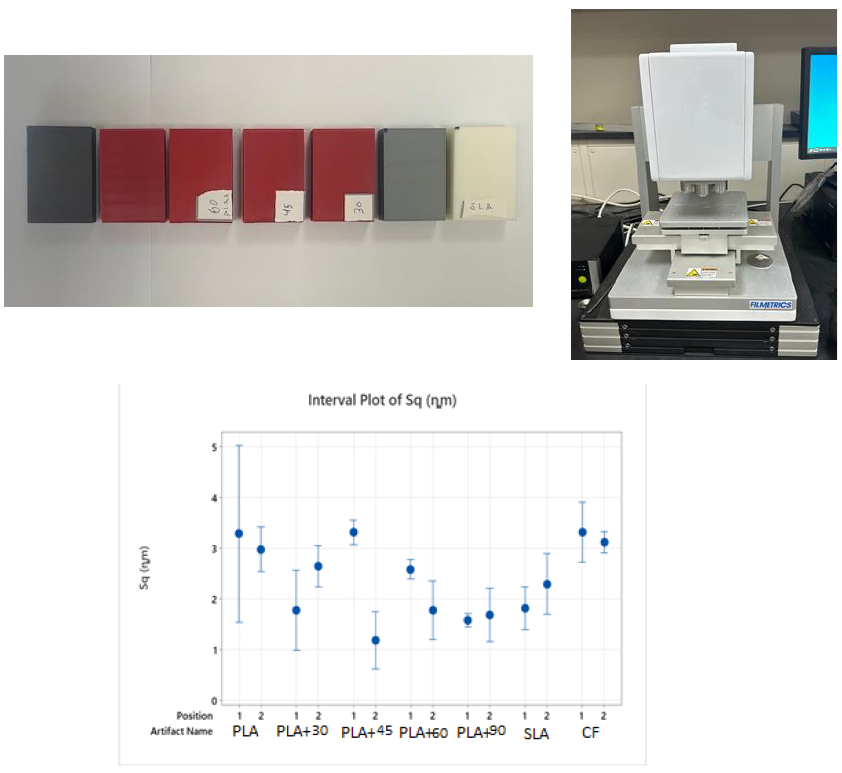
Figure 5 below presents results of a study to investigate the effect of surface materials and orientations on measurement noise [6].
This study uses a coherence scanning interferometry instrument and various additively manufactured polymer materials including PLA, SLA and CF (figure 5 top).
The results show that there is a significant effect of different surface materials and orientation on estimated measurement noise. We should consider this information when estimating measurement noise.
READ MORE: Five reasons why measurement uncertainty is important
Conclusion
To summary, we have discussed measurement noise as one of important metrological characteristics for areal surface topography measuring instruments.
Measurement noise is one of the main uncertainty contributors for surface texture measurements.
In practice, this is the first metrological characteristics to be determined likely due to its practicality to determine within a short period of time and by using the material that we are measuring.
The practical methods for estimating measurement noise are subtraction and averaging methods.
This measurement noise quantified noises contributed by an instrument itself as well as environmental noises, such as vibration variation, temperature variation as well as measurement parameters.
Finally, in practice and specifically for optical measuring instruments, measurement noise is specific to type of materials and its orientation, measurement parameters as well as environment conditions.
Reference
[1] Leach, R.K., Giusca, C.L., Haitjema, H., Evans, C. and Jiang, X., 2015. Calibration and verification of areal surface texture measuring instruments. CIRP Annals-Manufacturing Technology, 64(2), pp.797-813.
[2] ISO 25178-606:2015 Geometrical product specification (GPS) — Surface texture: Areal Part 606: Nominal characteristics of non-contact (focus variation) instruments
[3] Barker, A., Syam, W.P. and Leach, R.K., 2016, October. Measurement noise of a coherence scanning interferometer in an industrial environment. In Proceedings of the Thirty-First Annual Meeting of the American Society for Precision Engineering (Vol. 65, pp. 594-599).
[4] Giusca, C.L., Leach, R.K., Helary, F., Gutauskas, T. and Nimishakavi, L., 2012. Calibration of the scales of areal surface topography-measuring instruments: part 1. Measurement noise and residual flatness. Measurement Science and Technology, 23(3), p.035008.
[5] Alburayt, A. and Syam, W.P., 2025. Bayesian machine learning for measurement noise estimation of focus variation microscopy instrument. Measurement and Control, p.00202940251374964.
[6] Alburayt, A., Syam, W.P., Alharbi, M.A., Alturky, M. and Alfozan, K., 2025, May. Measurement noise characteristics of a 3D optical profilometer using additively manufactured materials. In 2025 The 16th International Conference on Mechanical and Intelligent Manufacturing Technologies (ICMIMT) (pp. 127-131). IEEE.
You may find some interesting items by shopping here.