Five reasons why measurement uncertainty is important
To understand the importance of measurement uncertainty in practice, we present at least five reasons of why measurement uncertainty estimation has an important role
Measurement uncertainty is one of the fundamental of metrology. A measurement uncertainty should be associated to a measurement result (see the definition in VIM) and not to an instrument. However, in practice, measurement uncertainty still may not be clear for many people.
Note that a measurement result $y$ should be presented in the correct format of:
$y=x\pm U$
where $x$ is a measured value and $U$ is the expanded uncertainty of the measured value. Moreover, there should be also explanations about the confidence interval represented by $U$ and the assumption of its statistical distribution. Finally, how $U$ is determined should also be explained.
To understand the importance of measurement uncertainty in practice, we present at least five reasons of why measurement uncertainty estimation has an important role in (1) measurement comparison, (2) measurement traceability, (3) pre-production phase, (4) post-production phase and (5) measurement/production process improvement.
Here are the five practical reasons why.
1. Measurement comparison
The fundamental practical reason of the importance of quantifying measurement uncertainty is to be able to compare different measurement results, either taken from different instrument manufacturers or taken at different places, of the same part or of any other the same quantities. In the context of manufacturing, especially for today global part supply chain systems, comparable measurements are very important for business agreement between two or more companies that supply and purchase parts among them.
A simple case, for example, there are two companies A and B that have an agreement. The agreement is that A will supply cylinders with diameter of $(5\pm 0.1)mm$ to B. One day, A supplied B with a cylinder having diameter of $5.1mm$. When B received the cylinder, B measured the cylinder as $5.15mm$. In this case, both A and B did not provide the measurement uncertainty. Hence, we cannot compare the measurement result done by both A and B.
Here is the reason why we cannot compare it?
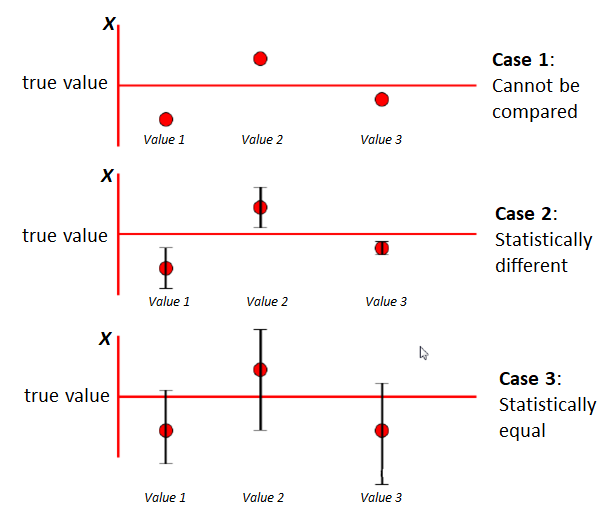
Figure 1 illustrates measurement result comparisons. In Figure 1, we have the values to compare in three different cases. The first case (top) shows a case where there are no uncertainties associated to the measurement results. Without uncertainty, we cannot compare the three values because when we repeat the measurements, the value will be different due to their uncertainty.
In the second case (middle), the three values have their associated uncertainty that is the error bar in the figure (let say the uncertainty represents $95\%$ confidence interval). These uncertainties values, with $95\%$ confidence, tell that the true value will be vary within the uncertainty limit. In the second case, since the uncertainties do not overlap, we can say that the three values are statistically different.
In the third case (bottom), similar to the second case, the three values have their uncertainty statement with $95\%$ confidence interval. However, unlike the second case, the uncertainties overlap each other. This overlap means that the three values are statistically equal.
From the three cases, we can understand the important role of uncertainties for reliable measurement result comparisons.
2. Measurement traceability
As being explained in the previous post, traceability is one of the fundamental concept in metrology. Traceability is a property of measurement results that can be related to an international reference value via an unbroken chain of comparison with stated uncertainty for each comparison result. For dimensional measurement, the reference value is the definition of metre.
When a measurement result is traceable, the results can be considered reliable and trustable and can be compared to other results (having their uncertainty statement as well). Figure 2 shows the traceability chain to the definition of metre for dimensional measurement.
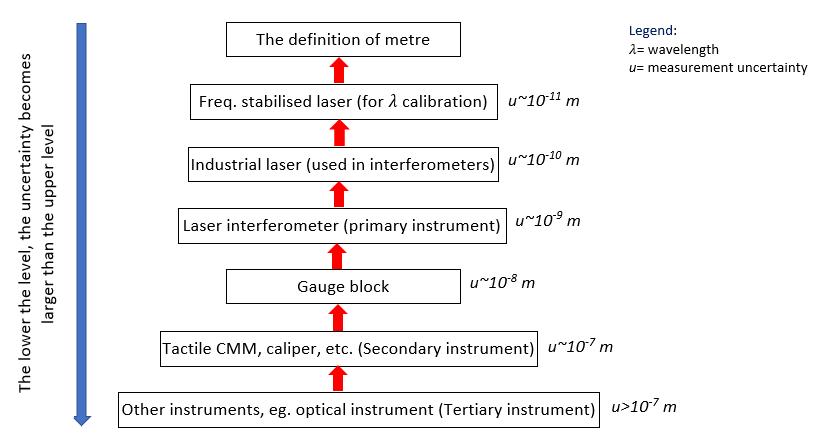
In figure 2, the definition of the metre is at the top and it is where the traceability chain stops. The definition is nominal so that there is no uncertainty associated with it. The traceability chain is established via calibration, that is the process to link between a bottom level and top level in the chain.
The explanation of figure 2 is as follows from the top to bottom. The first step is to realise the definition of metre by producing a calibrated wavelength $\lambda$ using a frequency-stabilised laser with very high precision. The theoretical foundation of this calibration follows the formula $f=c/\lambda_{0}$. When $c$ (speed of light) is known and very stable $f$ is provided, the calibrated $\lambda_{0}$ can be obtained with uncertainty of $10^{-11}m$. This $\lambda_{0}$ will be used as a “ruler” to know the other $\lambda$ from different waves.
The next level below, the $\lambda_{0}$ is used to determine the $\lambda$ of other waves, for example, red laser. The uncertainty of this $\lambda$ is at $10^{-10}m$.
When a $\lambda$ has been known, for example, red laser has $\lambda = 633 nm$, a laser interferometry can be constructed with the red laser to measure displacements. At this stage, the realisation of a length has been physically established with uncertainty at $10^{-9}m$.
The rest of traceability chain will be general laboratory levels until shop floor levels. The laser interferometry is used to measure and calibrate gauge blocks with uncertainty at $10^{-8}m$. These calibrated gauge blocks can be used to calibrate, for example, a coordinate measuring machine (CMM) and Vernier calliper with uncertainty at $10^{-7}m$. The calibrated CMM can then be used to calibrate other optical (non-contact) measuring instruments.
3. Pre-production phase
Measurement uncertainty is very important for decision making in pre-production phase. Figure 3 illustrates the importance in pre-production decision making. In figure 3, a process capability test for a production machine (in this case milling machine) is carried out to verify whether the machine can produce parts according to their specification (tolerance).
Process capability is carried out by producing a small batch of the designed parts, for example a production of 50 pieces. After the 50 parts are made, all of these parts are then measured with a measuring system, let say a CMM.
After the measurements, the process capability indices are then calculated, in this case $C_{p}$ and $C_{pk}$. $C_{p}$ is a quantitative index to understand the variation of a production process is still in the tolerance limit of a part produced by the process and $C_{pk}$ is a quantitative index to understand the mean shift of the process from the middle value of the tolerance of a part.
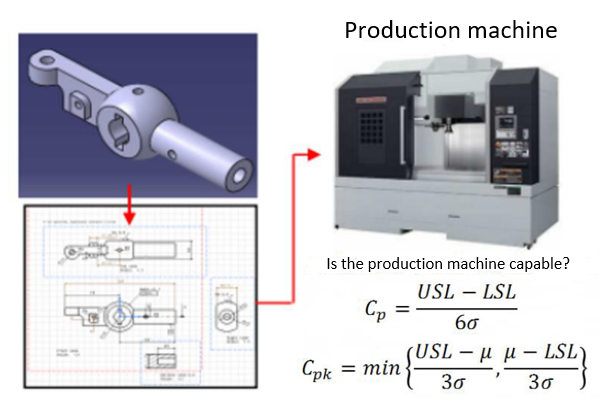
In figure 3, from the $C_{p}$ and $C_{pk}$ formulas, we can see that the value of $\sigma$ contains not only the variation from produced parts, but also the variation from measurement results, due to for example instrument errors and inconsistent measurement procedures, of the parts. In other words, measurement uncertainties have a significant effect to the value of calculated process capability indices.
For example, when the measurement uncertainty is large due to an incorrect measurement procedure, the value of process capability indices $C_{p}$ and $C_{pk}$ will be small (commonly < 1), meaning a production machine under evaluation is not capable of manufacturing a part according to its design tolerance. Then, managements will decide to purchase more expensive production machines. In fact, the machine under evaluation is actually capable of producing the parts, but since the measurement is not correct, the final process capability indices are incorrect as well, leading to a wrong management decision.
4. Post-production phase
The role of measurement uncertainty in post-production phase is in quality control process for conformance test between a part and its tolerance. The value of measurement uncertainties has an effect on the actual tolerance zone (on the 2D engineering drawing) of a part and should be considered for determining a conformance/non-conformance of the part (ISO 14253-1). Figure 4 shows the illustration on how measurement uncertainties affect the tolerance zone by reducing the allowable tolerance zone and hence making the acceptance zone to be narrow (meaning, the conformance decision becomes more stringent than what has been specified in the tolerance specification).
In figure 5, the tolerance specification of a part is shown. The specification has two limits: lower specification limit (LSL) and upper specification limit (USL). These two limits determine how much deviations from nominal on a part can still be accepted.
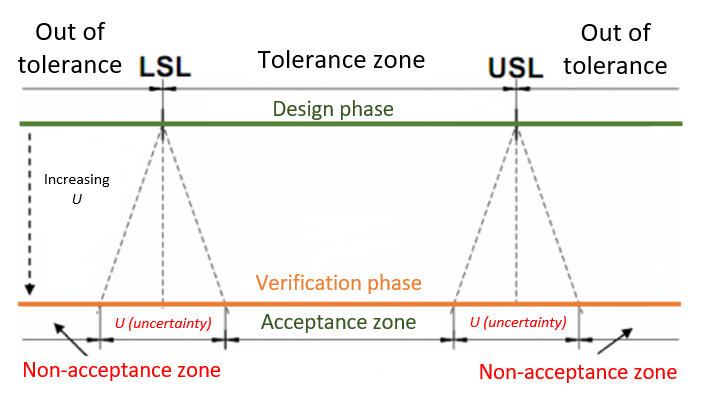
There are two phases shown in figure 5, design phase (green line) and verification phase (brown line). In design phase, the tolerance zone is $USL-LSL$ because there is no variation (uncertainty) in this phase. However, in verification phase, the tolerance zone is smaller than the one in design phase as much as two times of the measurement uncertainty values. The new tolerance zone in verification phase is $USL-LSL-2U$, where $U$ is the measurement uncertainty with common confidence interval of $95\%$.
The reduction of tolerance zone in verification (inspection) phase is due to the measurement uncertainty caused by, for example, variation in production processes and variation from measurement processes. From figure 5, to have an undisputed conformance/non-conformance, a part can be accepted if and only if its measurement result falls within the acceptance zone in verification phase ($USL-LSL-2U $). And otherwise, a part will be rejected if its measurement falls in non-acceptance zone (> $USL+U$ or < $LSL-U$).
It is very clear that the importance of measurement uncertainty in conformance/non-conformance decision. Without considering measurement uncertainty, a manager or quality control operator can have a wrong conformance/non-conformance decision. The wrong decision can be accepting a non-conformance part or rejecting a conformance part. These two types of the wrong decision will have a significant impact on increasing cost (reducing profit). For example, accepting a non-conformance part will cause a bad part is delivered to customer and will generate customer complains. These complaints will have a negative impact on a company credibility as well as can cause an additional return and repair costs. Rejecting a conformance part will cause unnecessary repair activities that increase the production cost of the part.
5. Measurement/production process improvement
The last example explains how we can use measurement uncertainty for process or product improvement. In this case, we will discuss an improvement on measurement process.
To estimate uncertainty, we should identify all contributors that significantly add to total measurement uncertainty estimations. After identifying the contributors, we need then to quantify those all contributors. These identification and quantification steps are called uncertainty budgeting. The result of an uncertainty budgeting activity is a list of all sources that cause uncertainty in measurements. After knowing the contributor and their contribution value to the total uncertainty, we can go through each contributor and verify which one or few of them are the main contributor to the total uncertainty and how to improve them.
Figure 5 shows an example of the uncertainty budget of a measurement process, in this case a length measurement with a measuring instrument. In figure 5, the example, the uncertainty contributors and numbers, is only an illustration for clarity.
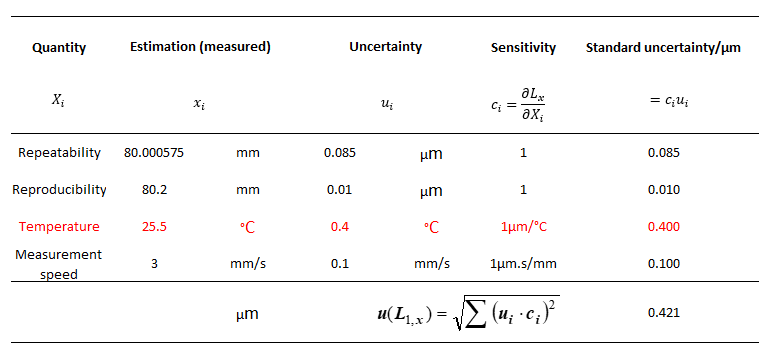
In figure 5, the contributors (“quantity” column) are measurement repeatability, reproducibility, ambient temperature and measurement speed. The “estimation” column shows the average value of each contributor. The uncertainty of each contributor is listed in “uncertainty” column. The “sensitivity” column represents how large each contributor uncertainty propagates to the total uncertainty and is also the unit conversion from each contributor unit to micrometre unit (for this length measurement case). The propagated uncertainties form each contributor to the total uncertainty are presented in “standard uncertainty” column. Finally, the total uncertainty of the measurement is the root of the sum of square of all standard uncertainty (following GUM).
As can be seen in figure 5, the contributor from ambient temperature where the measurements were conducted is contributing approximately 67% to the total uncertainty. Hence, from this information, we can understand what aspect need improving in the measurement process, that is we need to improve the environment of the measurement process by, for example, installing an ambient temperature-controlled system. The next improvement maybe to reduce the measurement speed of the measurement so that the uncertainty due to the speed can be reduced. In this example, we do not need to purchase a new measuring instrument with higher accuracy so that we can save cost. This example also shows how measurement uncertainty estimation activities can save production cost.
From the above five examples, we hope that the importance of measurement uncertainty becomes clear.
We sell all the source files, EXE file, include and LIB files as well as documentation of ellipse fitting by using C/C++, Qt framework, Eigen and OpenCV libraries in this link.
We sell tutorials (containing PDF files, MATLAB scripts and CAD files) about 3D tolerance stack-up analysis based on statistical method (Monte-Carlo/MC Simulation).