The economic benefits of tolerance stack-up analysis
Tolerance stack-up analysis has many advantages, especially from economical perspective.
Tolerance stack-up analysis has many advantages, especially from economical perspective.
Before discussing what economic advantages can be obtained by performing a tolerance stack-up analysis on an assembly process, we need to know first the types of cost from an assembly process.
After we discuss the type of cost in an assembly process, then we can go to see the economic advantage of the tolerance analysis for the assembly process.
Let us discuss it.
The types of cost from an assembly process
Fixed-cost
Fixed cost is the cost that relatively stays the same during the process of an assembly, even though the production rate changes. Some examples of fixed cost are the cost of fixtures, machine and conveyor belt.
Variable cost
Variable cost is the cost that always change following changes related to the activities of a production or assembly process. Some examples of variable cost are operator and electricity costs. These costs will increase following the increase of production rate. Because, the higher the production rate, the more electricity and operator required.
Material cost
Material cost in an assembly process has a slightly different meaning with material cost in a production process. In a production process, material cost is defined as the cost of material processed by the production process. In an assembly process, material cost is the cost related to the scrapping of a product due to assembly failure.
Another example of material cost in assembly process is the cost of lubrication used to support the operation of machines related to the assembly process.
Administrative cost
Administrative cost is the cost that occurs due to supporting activities of an assembly process. Some examples of administrative cost are the cost related to staff of a design department, the salary of a manager, and other salary costs.
Direct cost
Direct cost is the cost that can be directly allocated for an assembly process.
Direct cost includes: material cost, fixed cost, variable cost and operator-related cost (including supervisor and manager).
Indirect cost
Indirect cost is the cost related to management in general, such as the cost from human resource, document printing, brochure printing and others.
Indirect cost is not easy to estimate. Because, many factors that are not obvious or invincible need to be considered.
Indirect cost is also called overhead cost.
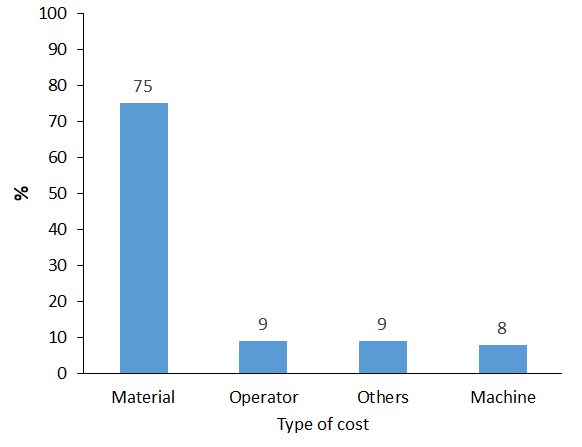
Figure 1 above shows one of real examples of the cost distribution of the engine production process in an automotive company in a large production volume.
From figure 1, the main source of cost is material cost used to cast engines. Meanwhile, the least cost is from the purchasing of production machines. Here, we can see that in a large volume production, machinery cost becomes not very significant!
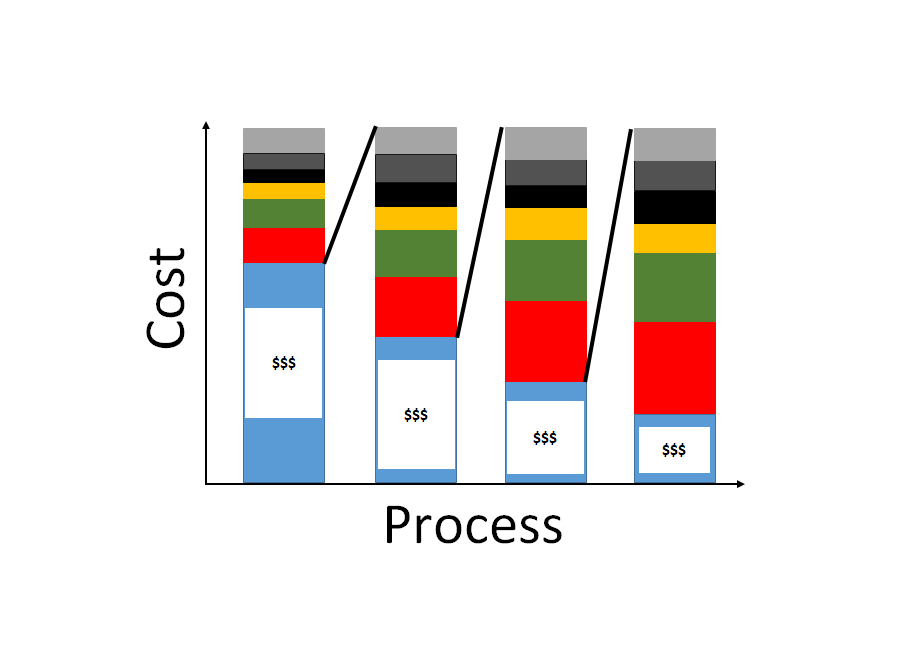
Meanwhile for an assembly process, the cost from the final assembly process until tier 5 in an automotive industry is shown in figure 2 below.
In figure 2, the highest cost at the final assembly line comes from the cost of purchasing parts from Tier 2 suppliers and from the assembly process.
Meanwhile, at Tier 5 supplier, the highest cost comes from the logistic cost of materials, for example, distribution cost and warehouse/storage cost.
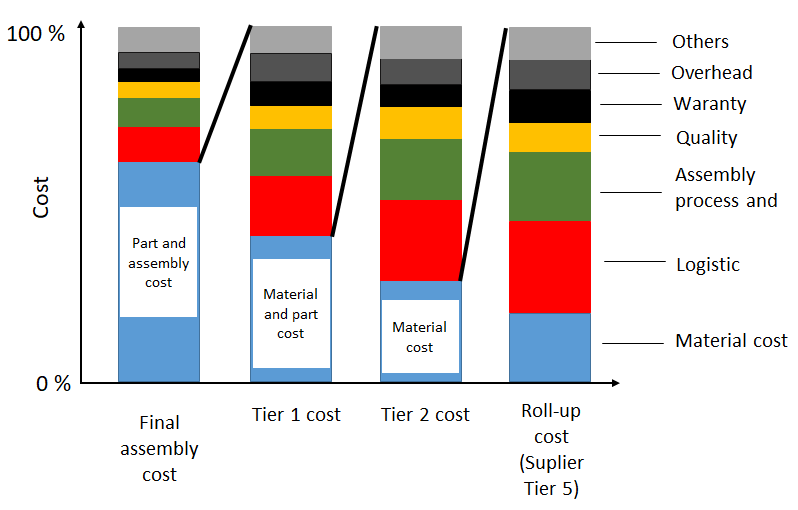
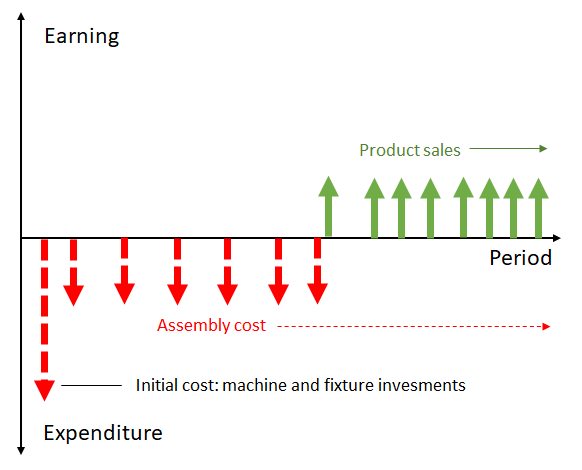
Figure 3 below illustrates how the change of cash flow during time evolution in a production process.
At the early stage, the largest expenditures come from the purchasing of machinery for production processes, such as turning and milling machines, including fixturing system for assembly process and part holding.
Then, the cost decreases and stabilises due to operational activities of the production process.
After the stabilised cost, some earning will be obtained when products started to be sold to customers.
Note that costs are still exists even after products are delivered to customers. These costs come from, for example, marketing cost and after-sale-support cost.
The role of tolerance stack-up analysis to get economic benefits
The economic benefits of tolerance stack analysis are, for some of them, as follows:
Reducing the numbers of line-stop in an assembly process
By performing tolerance stack-up analysis at a design stage, design flaws can be detected at a very early stage so that the flaws can be easily and cheaply fixed.
Because, when a product has design flaws, even though all the components that constitute the assembly are produced perfectly, the key characteristic (KC) of the assembly will still be out of its tolerance.
When the design flaws are detected at its final assembly process, it will cause a long line-stop to find where and what are the flaws. Also, repair work will be large and expensive.
On the other hand, when the design flaws are detected at the design stage, the design flaws can be easily fix (mostly by modifying the 3D CAD model of the parts).
Reducing product scrap
By doing tolerance stack-up analysis, the number of scraps at a final assembly process can be significantly reduced. Because, in general, when there are design flaws detected at a final assembly line, it will be difficult to fix the flaws or defects so that the products tend to be scrapped.
Reducing product repair cost
As being mentioned earlier, a product that has design flaws will require a long repair time (if it is possible to be repaired) with additional numbers of operators or technicians required. This repair activity will significantly increase material costs and operator cost (usually from overtime cost).
Reducing fixturing cost
With tolerance stack-up analysis or variation transformation chain analysis, beside design flaws can be detected, design revision and improvement can be performed.
The revision and improvement can be the reduction of the number of components constructing an assembly.
The reduction of component number will directly reduces material costs and will indirectly reduce production cost of the assembly.
In addition, the analysis of assembly features can be performed so that the number of assembly features can be reduced so that the production process steps will be reduced as well.
Reducing production and inspection costs
By performing tolerance stack-up analysis, the tolerance values of the features on parts can be correctly allocated.
“Correct tolerance allocation” means that the values of the tolerances of the features are not too small (over-specification) and the KC variations of the part assembly are still in tolerance.
When we have the tolerance values of the parts that are not too small, the production and inspection costs of the parts can be significantly reduced as the parts do not require too high precision.
Too small tolerance values (over-specification) will require high-precision machinery and inspection machine that are very expensive.
Reducing the use of material
From tolerance stack-up analysis, we can correct the design of an assembly and design correct features. By doing good design features, part scraps can be reduced at a final assembly line.
With the reduction of scrap at the final assembly and the reduction of fixturing systems, total required materials will reduce as well.
Increasing product quality
With a good design that has been verified with the help of tolerance stack-up analysis, a finished product assembly can meet their KC tolerances.
Hence, the product can function as desired and has a good quality. This functioning product will cause high customer satisfactions. With high customer satisfactions, the product will be purchased and generate profits.
Conclusion
In this post, we discuss the benefits of performing tolerance stack-up analysis or tolerance variation chain analysis by focusing on the economic perspective.
It is clear that, by performing the analysis, a huge economic advantage can be obtained by significantly reducing the total final assembly cost, and also the production and supplier cost, of a product.
By reduced cost, the profit margin and the quality of the product can be increased. Additionally, positive customer satisfactions will be obtained.
We sell all the source files, EXE file, include and LIB files as well as documentation of ellipse fitting by using C/C++, Qt framework, Eigen and OpenCV libraries in this link.
We sell tutorials (containing PDF files, MATLAB scripts and CAD files) about 3D tolerance stack-up analysis based on statistical method (Monte-Carlo/MC Simulation).