Digital transformation of dimensional and geometrical measurements
Today era is the time for thorough digitalisation, from product design, process design to data analysis and executive summary making.
Today era is the time for thorough digitalisation, from product design, process design to data analysis and executive summary making. Obviously, all of these digitalisations are the by-product of the affordability and widespread high-performance computing, the development of advanced censors, improved network technology and infrastructure, advanced algorithms and other advancement of supporting tools and infrastructures.
Digital transformation also happens to dimensional and geometrical measurement processes, both for the instrument and process (data analysis). A lot of machines-learning supported data analysis algorithms are used for dimensional and geometrical measurements. The goal is to provide better extracted information from data.
In general, the digital transformation converges into one goal, that is to improve measurement performances. These performances include measurement accuracy, precision and speed. A new field called in-process measurement emerges at this digital era.
Let us go to the discussion!
- Focus variation microscopy: performance and uncertainty evaluation- Dimensional and form measurements with optical CMMs
Digital manufacturing: The modern age of manufacturing
Digital manufacturing (also called smart manufacturing) is an application of an integrated computer system from a product design phase to the realisation of the product including an advanced management system that control a complex production or manufacturing processes [1].
Digital manufacturing is part of industry 4.0 where individual activities (product design, manufacturing and assembly, quality control and supply chain) are being transformed into an automated, flexible and efficient connected system.
The direct product of this digital manufacturing is that manufacturing processes and quality inspection processes are digitised so that all sensors (both for processes and data acquisition) are connected to each other including to external suppliers.
The manufacturing and quality inspection processes are transformed into a knowledge-based system using digital technologies. Note that, there are abundance of data available in this digital era, the question is, do all data good? This is what we need to be careful of.
Evolution of dimensional and geometrical measuring instruments throughout history
Dimensional and geometrical measuring instruments have undergone evolution steps throughout the twentieth history. There are three pivotal evolutions of the measuring instruments.
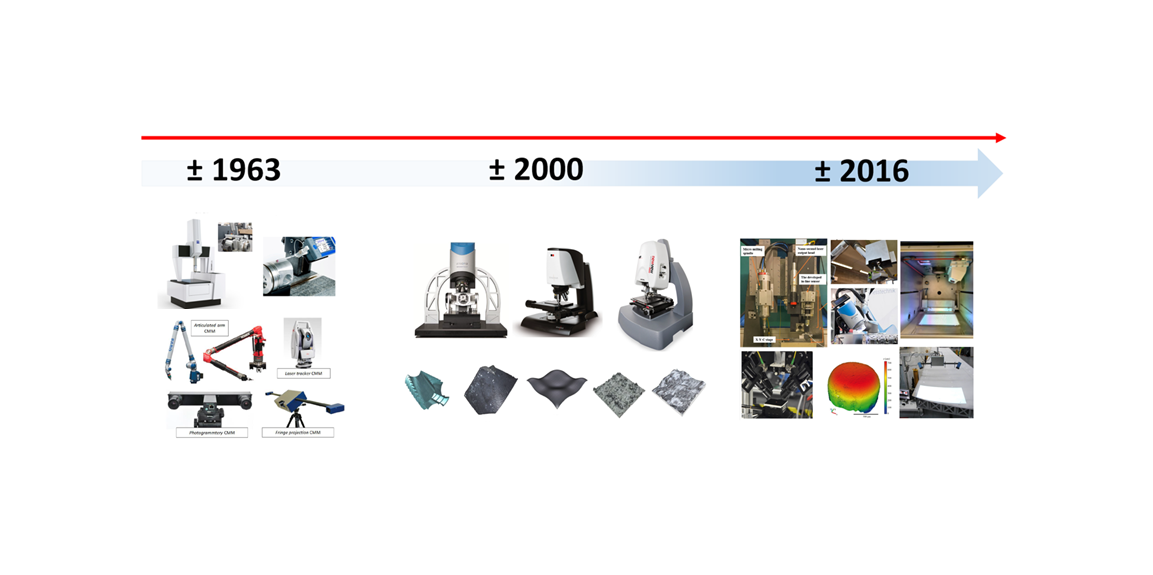
Figure 1 below shows the evolution of measuring instruments in the history before and after digital manufacturing. Form figure 1, there are three pivotal evolutions in ± 1963, ± 2000 and ± 2016.
Year ± 1963 marks the first era of automated dimensional and geometrical measurements that are supported by new measuring instruments utilising computer numerical controlled automation. This evolution phase last for about 40 years. At the end of this first phase, a very high accurate contact (tactile) coordinate measuring machines (CMMs) became popular with typical accuracy of 0.1 micrometre. In addition, off-line optical CMMs based on photogrammetry, fringe projection and laser tracker for medium to large scale part measurement also became popular with typical accuracy of 50 micrometre for fringe projection and photogrammetry systems.
Year ± 2000 is the era of micro- to nano-metre scale optical measuring instruments with typical accuracy of 2-10 micrometre. There are various methods of these instruments, such as focus variation microscopy (FVM), coherence scanning interferometry (CSI), confocal microscopy (CM), point autofocus microscopy (PAM), scanning probe microscopy (SPM) and others. Each of these optical instruments become mature and have their own use in industry and actually they compete each other in industry to gain market share!.
The main characteristic of these instruments is that the instruments can collect a large amount of data points (typically millions of data points) in a relatively short time but for only the small area of a part surface, typically few mm by few mm area. In addition, they are sensitive to environmental noise, such as vibration and temperature variation.
Year ± 2016 onwards, this is the era of digitalisation where integrated or in-process measuring instruments become important and are needed. Because all processes are connected and all data can be collected online and sent to a server for processing within a short period of time if not real-time. In this era, fast and accurate optical measuring instrument that is robust to environmental noise, such as vibration and temperature variation are urgently required!

In figure 1, there are two main timeline directions, that are the evolution process towards digital manufacturing. At the same time, the uncertainty of measurement results from the latest evolution of instruments become larger than before. Especially, this large uncertainty is due to more uncertainty contributors during the measurement. That is, the measurement becomes more and more challenging than before.
In-process measurement definitely more challenging than off-line instrument. Because in shop floor, many noise are relevant compared to laboratory measurements. For example, floor vibrations from machines and compressor and temperature variation are very common in shop floors.
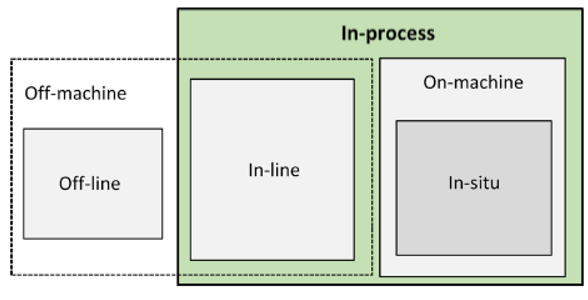
Figure 2 below shows the scope of terms related to different kind of measurements [1]. In figure 2, there are two main group of measurements: off-line and in-process (on-line) measurements.
Off-line measurement is a measurement process are performed in a controlled laboratory outside a production line or shop floor.
Meanwhile, in-process measurement is a measurement process that is carried out in a shop floor or production line. In-process measurement can be inline, on-machine or in-situ.
In-situ measurement is the most challenging because the measurement is inside a manufacturing chamber while the manufacturing process is still in progress. On-machine is a measurement where the process is performed in a manufacturing line before or after a manufacturing process. Finally, inline measurement is a measurement where the process is still in a shop floor but outside a manufacturing line.
Current status and challenges to develop in-process measuring instrument
Current status of dimensional and geometrical measuring instruments
At the moment, the most used optical method for in-process measurement is by using 2D imaging system to measure dimensional and geometry of parts. There is still an implementation of tactile CMM on a shop floor. But this tactile CMM is slow and very often become the bottleneck of the whole manufacturing process.
Some photogrammetry and fringe projection systems have also been implemented for in-process medium to large parts. Again, the total measurement process, from data acquisition to data processing, is still considered slow compared to the manufacturing process speed.
The main status (including barriers) of implementing in-process measurement in industries are as follow:
- The technologies (sensors, methods, algorithm) to support in-process measurement are still developing
- The commissioning cost of production lines will be high. But, in a long term this high cost will be justified
- The main target of in-process measuring instrument is to reduce the total measurement time to be at least the same of the manufacturing process if not less
- The need to use measurement data from in-process measuring instrument as feedback to manufacturing processes for process control
- The main common methods, optical (2D imaging and some 3D imaging) and acoustic emission
Challenges to develop optical in-process measuring instruments
There are more challenge to implement in-process measurements compared to off-line measurements. Some of those challenges are as follow [3,4]:
- Method and technology. Need to measure wide area with sufficient resolution, high surface slope, high surface reflectivity in harsh environment (vibration, humidity and temperature variation)
- Measurement speed. The total measurement speed (including data processing to give results) should be at least the same with the speed of manufacturing process
- Control and system integration. The utilisation of multi-sensor data fusion and measurement integration into different system level, including the enterprise resource and planning system
- Traceability. The need of new reference artefacts and methods to quantify emerging uncertainty contributors that are relevant for in-process measurements
- Intelligent. The use of effective and efficient machine learning and data fusion algorithms
Fundamental limits of optical measuring instrument
As mentioned before, the most suitable method for in-process measuring instrument is optical method. Because optical method relatively can collect more data at higher speed compared to tactile systems as well as good part surface accessibility.
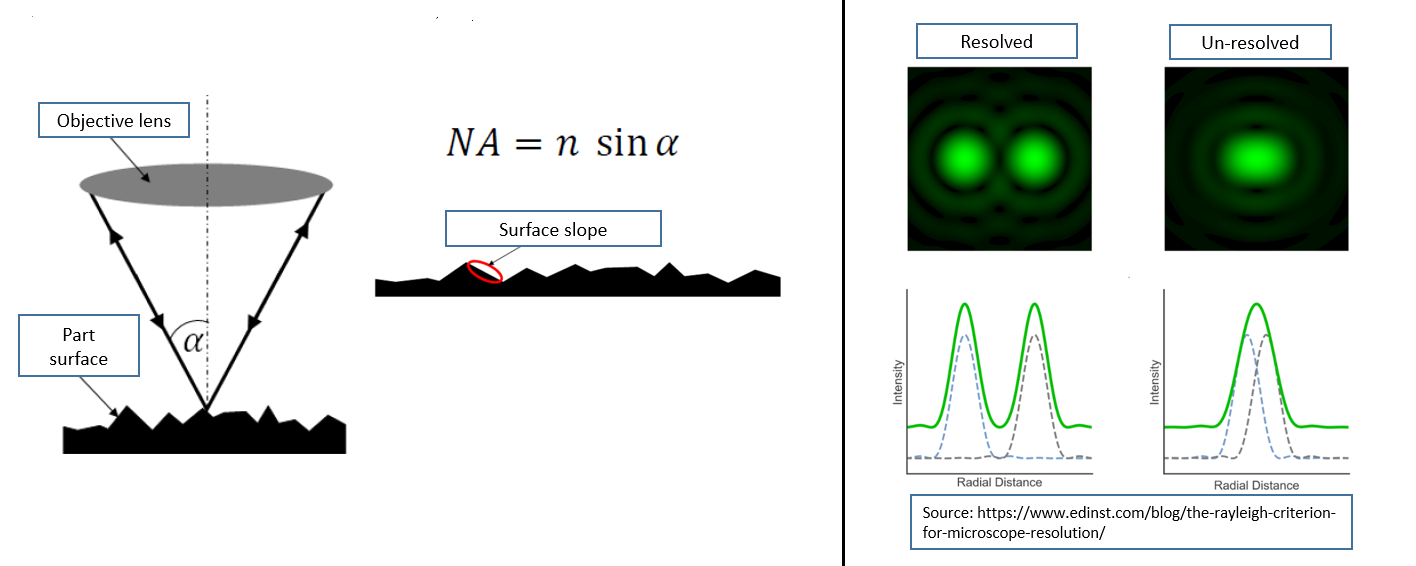
However, there are two fundamental limits that are relevant to all optical measuring instruments. The fundamental limits are numerical aperture and optical resolution limits.
Figure 3 below shows the illustration of the two fundamental limits of optical instruments.
In figure 3 left, each optical system view is limited by its numerical aperture. Hence, not all light from the surface will be captured back by the optical sensors. This situation causes missing information from for surfaces and limit the maximum surface slope that is able to be measured by an optical sensor.
In figure 3 right, the optical resolution limit is illustrated. This limit depends on the characteristics (hardware and design) of optical instruments. This limit is the smallest distance that an optical instrument can differentiate two different points separated with a small distance each other.
READ MORE: Error sources on coordinate measuring machine (CMM) measurements and environment control
Methodology to develop in-process measuring instrument
To address the problem of developing in-process measuring instruments, a methodology to develop this type of instrument has been proposed.
Figure 4 below shows the proposed methodology [3,4]. In figure 4, there are three phases to develop in-process measuring instruments.
The fundamental idea of the methodology is to utilise all available information (both related to product and process). the information includes computer aided-design (CAD) model of a part, manufacturing process, physical model of light-surface interaction, mathematical model of a measurement, measurement simulation and other information.
This information is aggregated by using smart data processing, leveraging machine learning algorithms.
It is important to note that for developing in-process measuring instrument, we need to focus and emphasize on specificity and not versatility. That is, we need to design a fast and accurate instrument for a very specific part feature measurement and not for general or many different types of feature measurements.
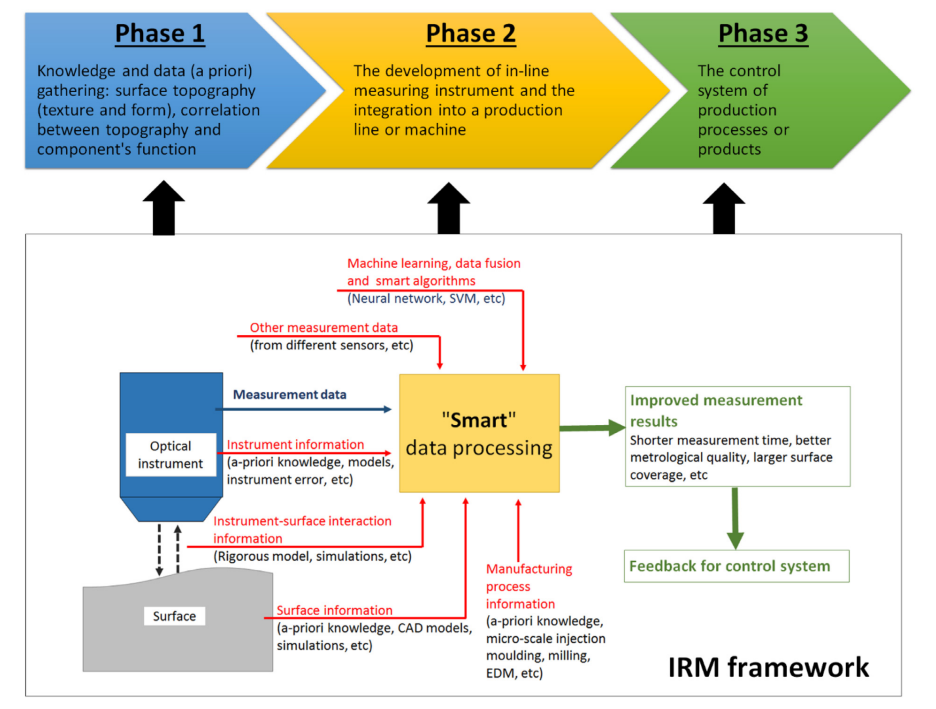
The three phases of the instrument development are explained as follow (figure 4 above). Phase 1 is the phase to gather all knowledge and data about the measurement and a phase where we need to find which features to measure that really affect the function of a part or process. This phase can be fast or can be long (several months or more) depending on how difficult to find the best feature to measure.
Phase 2 is the development of a in-process measuring instrument. The development includes both hardware and software. This phase also includes the integration of the developed instrument into a production line or machine.
Finally, phase 3 is the phase of the use of in-process measurement data to give feedback to a manufacturing process so that the process can be control and improved.
Examples of in-process measuring instrument development
Until now, there are developments focusing on producing industrial in-process measuring instruments. Figure 5 below show just few developments that have been reported in literatures.
As can be seen in figure 5 below, all in-process measuring instruments that have been developed or in developments are based on optical methods. Also, the inclusion of machine learning algorithms into measuring algorithm pipeline is becoming common nowadays.
The machine learning algorithms are used to improve measurement performance, in term of speed and accuracy. Many of the developed instruments are microscope-based instruments. That is, they can capture high density of data but for a small area of surfaces. The utilisation of collaborative robot as sensor actuator or positioning tools is becoming common nowadays.

READ MORE: The history and introduction of CMM: the inseparable relation between CMM and GD&T
Comparison between the measurement results of an off-line and in-process (on-line) measurement
Obviously, obtaining good measurements for in-process measurement is more difficult than the case of off-line measurements. There are more error contributors for in-process measurement process.
For example, in-process measurements are commonly performed at room temperature > 25 degree C. This temperature condition will give significant part and instrument component expansions and subsequently cause measurement errors [6]. Another example is that vibration from a shopfloor due to vibration from nearby machinery as well as air compressor motor [5].

Figure 6 above shows two examples of in-process measurement results that are compared with their off-line measurements. Figure 6 left shows the noise on a measured optical flat that cause from the air conditioning vibration. At sub-micro or nano-meter scale, the small vibration from the ground becomes relevant to the final measurement result validity.
Figure 6 right shows the comparison of a laser-drilled holes between in-process focus variation microscopy and off-line focus variation microscopy.
As can be seen in figure 6 right, the in-process (on-machine) measurement results have larger errors compared to the same measurements that are performed off-line in a controlled laboratory.
The ground vibration from the machine itself and machine nearby really degrade the measurement results up to three to four times than the off-line measurements.
Conclusion
In this post, the digital transformation that happens to dimensional and geometrical measurements has been presented and discussed. The history timeline, current status of dimensional and geometrical measurements as well as the challenges for the digital transformation are also presented.
A methodology to develop in-process measuring instrument is proposed and explained. The methodology leverages different fields or disciplines, from instrument design, electronics to machine learning disciplines. Finally, some examples of in-process measuring instrument developments as well comparisons between off-line and in-process measurement results are presented.
References
[1] Tao, F., Qi, Q., Liu, A. and Kusiak, A., 2018. Data-driven smart manufacturing. Journal of Manufacturing Systems, 48, pp.157-169.
[2] Leach, R , 2020. Integrated metrology: 10-year road map for advanced manufacturing. High Value Manufacturing CATAPULT Report (April 2020)
[3] Syam, W. P. (2020). In-process surface topography measurements. Leach RK Advances in Optical Surface Texture Metrology (IOP Publishing).
[4] Syam, W. P., Rybalcenko, K., Gaio, A., Crabtree, J., & Leach, R. K. (2019). Methodology for the development of in-line optical surface measuring instruments with a case study for additive surface finishing. Optics and lasers in engineering, 121, 271-288.
[5] Barker wt. al. 2016. Measurement noise of a coherence scanning interferometer in an industrial environment Proc. ASPE 594–9
[6] Santoso et. al., 2020. On-machine focus variation measurement for micro-scale hybrid surface texture machining. The International Journal of Advanced Manufacturing Technology, 109: 2353-2364
You may find some interesting items by shopping here.