The effect of vibration on dimensional and surface topography measurements
In this post, we will explore the effect of vibration on precise dimensional and surface topography measurements.

In this post, we will explore the effect of vibration on precise dimensional and surface topography measurements.
In precise measurements, small vibrations have substantial impacts on measurement accuracy.
Because, typically, precise measurements often have tolerances in micrometre or submicrometric as well as nano metre levels. At these levels, even a very small vibration level is relevant!
We will use several measurement case studies to explain vibration effects on the results of precision measurements.
READ MORE: Surface topography measurement: 2D profile measurements
Effect on geometrical measurement with tactile CMM
Coordinate measuring machine (CMM) has been the industrial standard for dimensional and geometrical measurements for many years.
With CMM, we can measure various types of dimensions, such as dimeter, length and depth, as well as geometries such as straightness, flatness, roundness and perpendicularity.
These geometrical measurements are for verifying GD&T tolerances.
CMM machines will generate vibrations when they move to performing a measurement. The CMM body will typically generate low-frequency vibrations at around <5Hz and the lower mass components, such as the probing probe of the CMMs will generate medium frequency vibration at around 20-30Hz [1].
Figure 1 below shows the spectrum of the vibration signals of a CMM machine measuring at 10mm/s speed. This measurement was carried out at a controlled laboratory environment.
From this figure, just from the CMM machine operating at the controlled laboratory room, there are vibrations generated at two different frequencies.
When we perform a CMM measurement at a shop floor, we will have more vibration sources (such as from shop floor and nearby machine vibrations) than in a controlled room.
Due to these reasons, our measurements at shop floor will be more challenging compared to when we perform the measurement in a controlled room.
![Figure 1: The spectrum of the vibration of a CMM machine measuring at 10mm/s speed [1].](https://storage.ghost.io/c/ec/01/ec011f95-b1fe-40ec-8fec-21a0fa3177e3/content/images/2026/04/fig1.png)
Vibration is one of influential uncertainty factors for CMM and other types of measurements [2]. One of the reasons is that, in CMM, vibrations affect the behaviour or the probing sensors on detecting the location of a part surface as well as affecting the true position of the part (in micrometre scale).
In industry, we always want to find the trade-off between productivity and measurement accuracy.
To improve productivity, we must increase measurement speed. However, the increased measurement speed will increase the machine dynamics and hence will increase the vibrations causing the reduction in measurement accuracy.
In addition, the dynamic effects will even be stronger for measurements on small parts compared to bigger part measurements [3].
Figure 2 below shows the effect of measurement speed on the deviation of roundness measurements.
From figure 2, the roundness deviation is larger on parts will small diameter (in this case 5mm) compared to other parts with larger diameter (in this case >20mm).
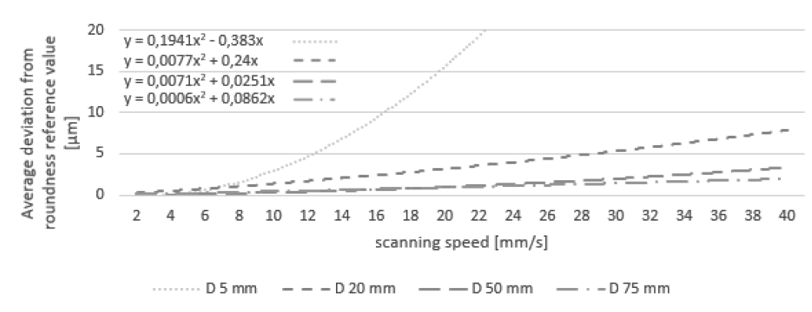
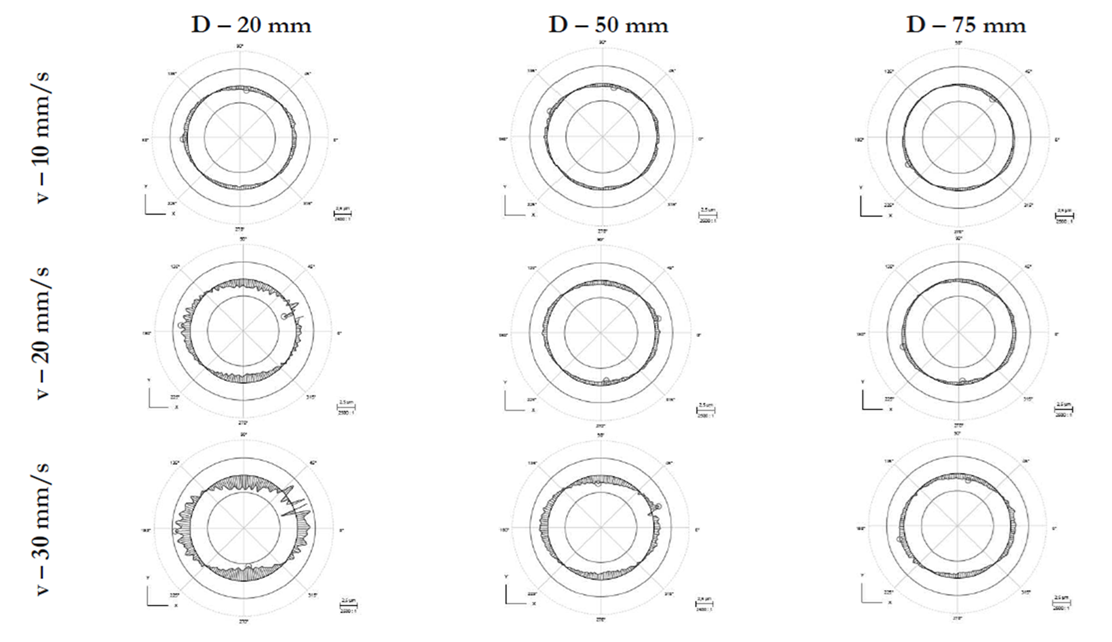
Figure 3 below shows the effect of measurement speed and part diameter on the real roundness data reading.
From figure 3, we can observe that the highest roundness deviation reading occur on the highest measurement speed (at 30mm/s) and for smallest part diameter (at 20mm).
This experiment shows the non-linear deviation growth effect when we increase measurement speed on a part with small diameter (feature size). We need to consider these aspects when preparing CMM measurement strategy before performing a measurement.
From the discussion above, there will be a trade-off point where we have the possible maximum speed while keeping an expected measurement accuracy.
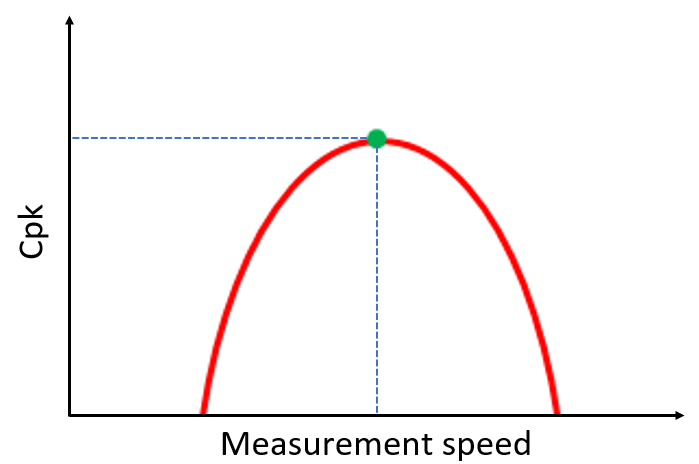
Figure 4 below shows the trade-off between process capability and measurement speed. Process capability, typically represented by Cpk indices, will have high value when we have high accurate measurement results.
Meanwhile, when we increase measurement speed, we will increase our overall manufacturing productivity.
However, there is a limit on maximum allowable measurement speed we can set before we degrade the accuracy of our measurements due to excessive vibration effects due to measuring instrument dynamics, in this case CMM.
READ MORE: The role of measurement uncertainty in quality inspection
Effect on measurement noise
In surface texture measurements, measurement noise is one of the most important quantities to calibrate a surface texture measuring machine, such as stylus instrument or optical instruments.
Measurement noise will add up to the total estimated measurement uncertainty of a surface measurement.
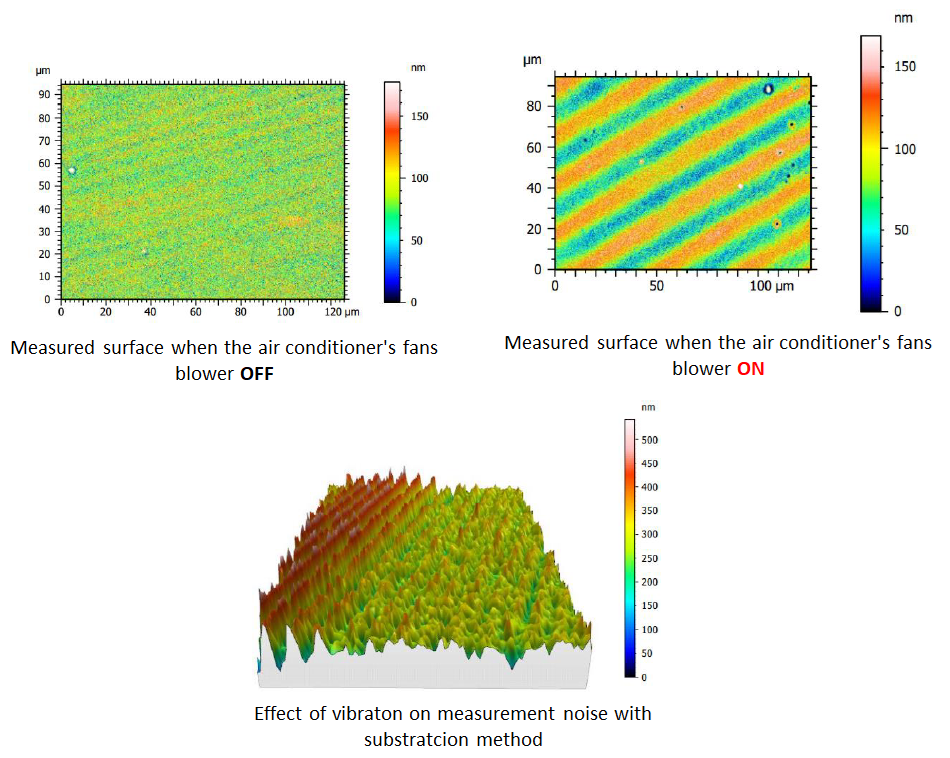
Measurement noise is very sensitive to vibration. A study in [4] have shown how the fan blower of the air conditioner (AC) in a laboratory can substantially increase the measurement noise of an optical coherence scanning interferometry (CSI).
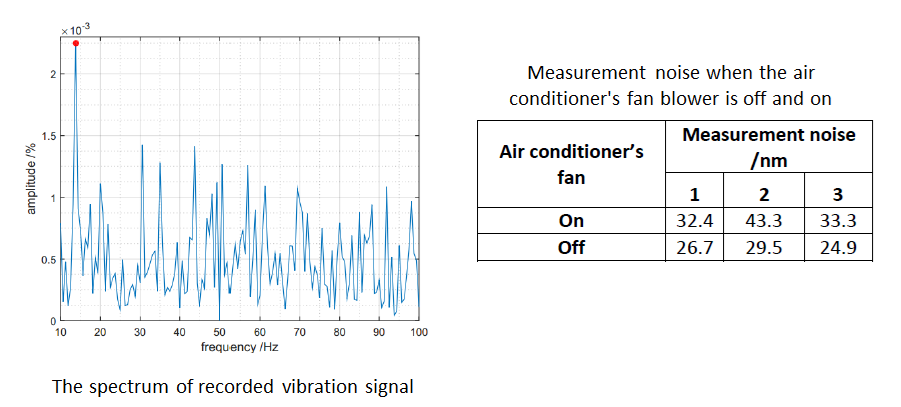
Figure 5 below shows the spectrum of the vibration signal recorded from a vibration sensor placed on top of the CSI measurement table and the measurement noise calculated for two conditions, when the AC is on and off.
From figure 5, the vibration from the AC fan blower has approximately 15Hz frequency. This vibration causes an increase in measurement noise for about up to 9.3nm in average, from 27.03nm to 36.6nm, when the AC is on.
When we observed the measured surface data points from the CSI measurements, we can distinctively recognise the impact of vibration on the measured surface data.
Figure 6 below shows the visualisation of measured data points when the AC is on and off as well as the measurement noise data points.
From figure 6, we can observe the oscillation pattern on the measured surface data points due to vibration on the AC’s fan blower. From these results, we must be careful on performing surface texture measurement in the even where significant vibration source exists, such as AC or other vibration sources.
In addition, when the AC is on and vibration is significant, the subtracted data points from two surfaces to estimate measurement noise is significantly deteriorated and cause non-stationary effect on the data points.
This non-stationary effect causes the measurement noise estimation cannot be improved even though we use many surface measurements. That is, the averaging effect becomes not effective anymore for measurement noise estimation in the presence of vibration [4].
Effect on micro-scale dimensional measurement
The final example in this post is the effect of vibration on on-machine measurements [5].
Currently, the trend in measuring technology to increase overall productivity of a manufacturing system is to reduce the total time of measurement.
To achieve this, instead of taking parts from a shop floor and move them into a measuring machine installed outside the shop floor, in-line measurements, including on-machine, becomes a way forward in measuring technologies to improve productivity.
The challenge of in-line measurement is significantly higher than off-line measurement performed in a controlled laboratory. Because in-line measurement means a measurement is carried out in harsh environment where temperature, pressure humidity and vibration variations are not under controlled.
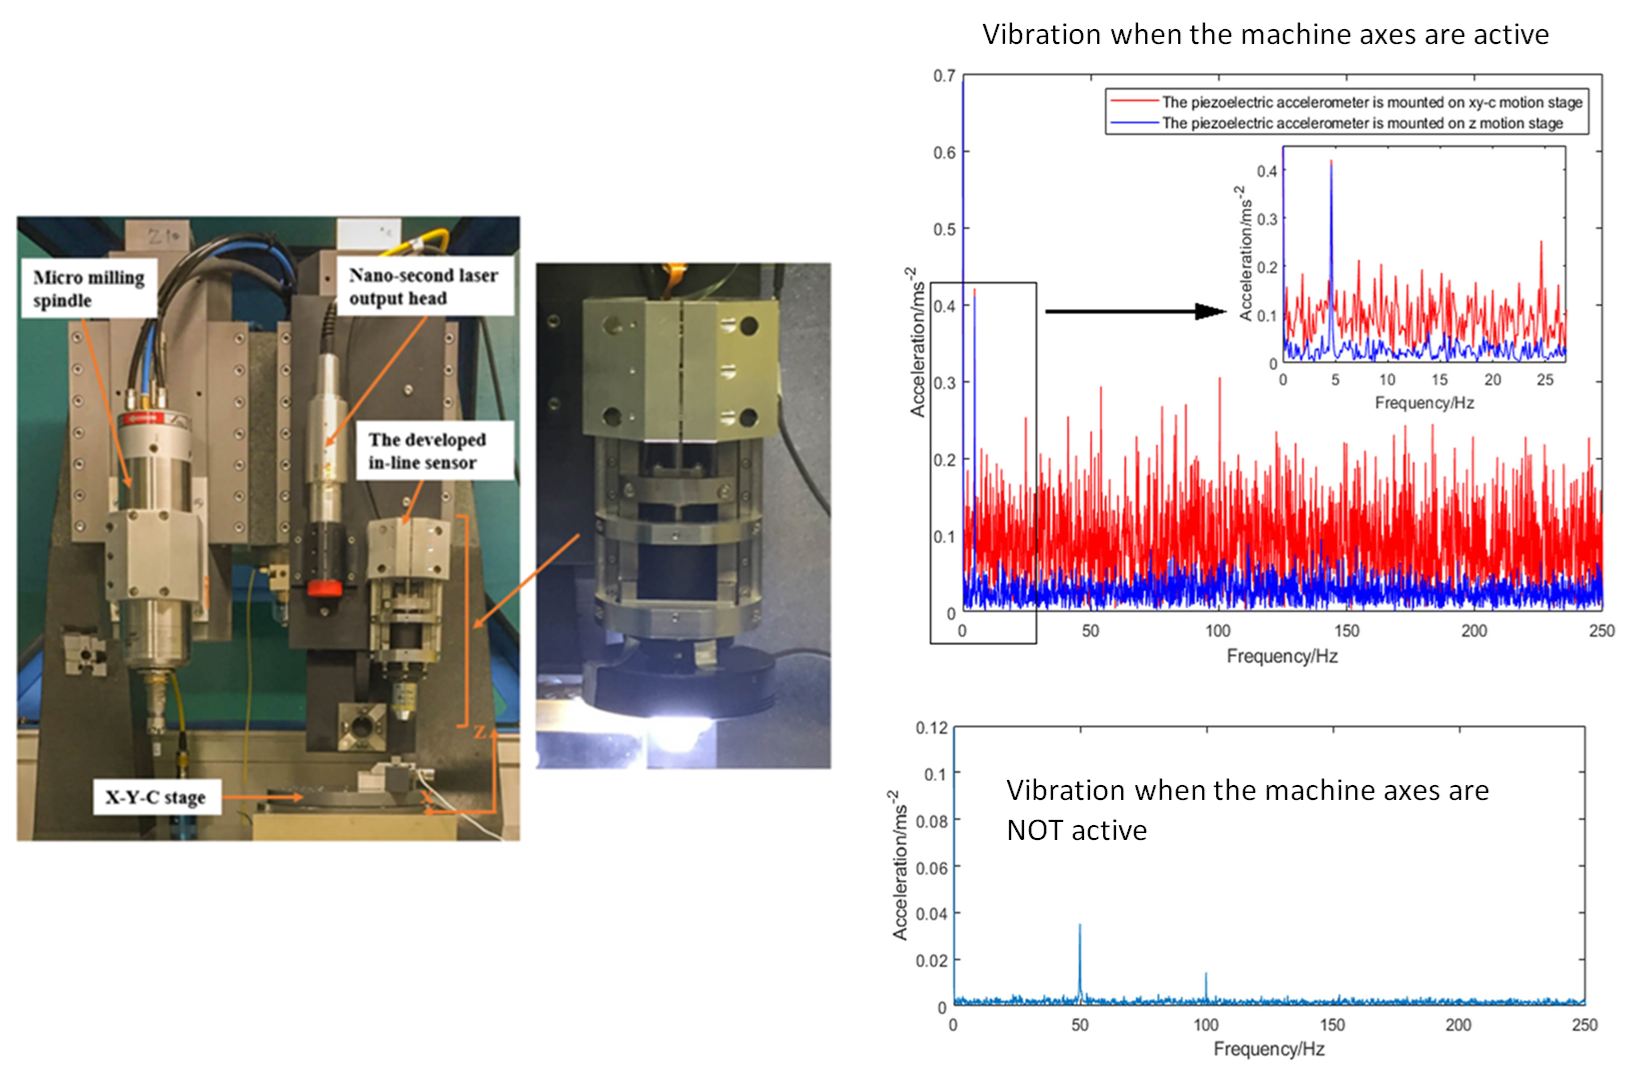
Figure 7 below shows an experimental example of an on-machine optical surface texture measuring machine based on focus variation microscopy method.
In figure 7, the measuring instrument is installed beside the spindle head of a machine tool and can measure part directly on the machine chamber after a machining process has finished.
The vibration effect in this on-machine conditions is large. From figure 7 right, we can observe that when the machine axes move, the vibration becomes large.
The vibration on X-Y direction (lateral) is larger than in the Z-direction (vertical).
Even in the case of the machine axes are off, there are still significant ground vibration propagated from surrounding machines. The ground vibration is at frequency of 50Hz and 100Hz suggesting that the vibration sources could be from the compressor of other surrounding machines.
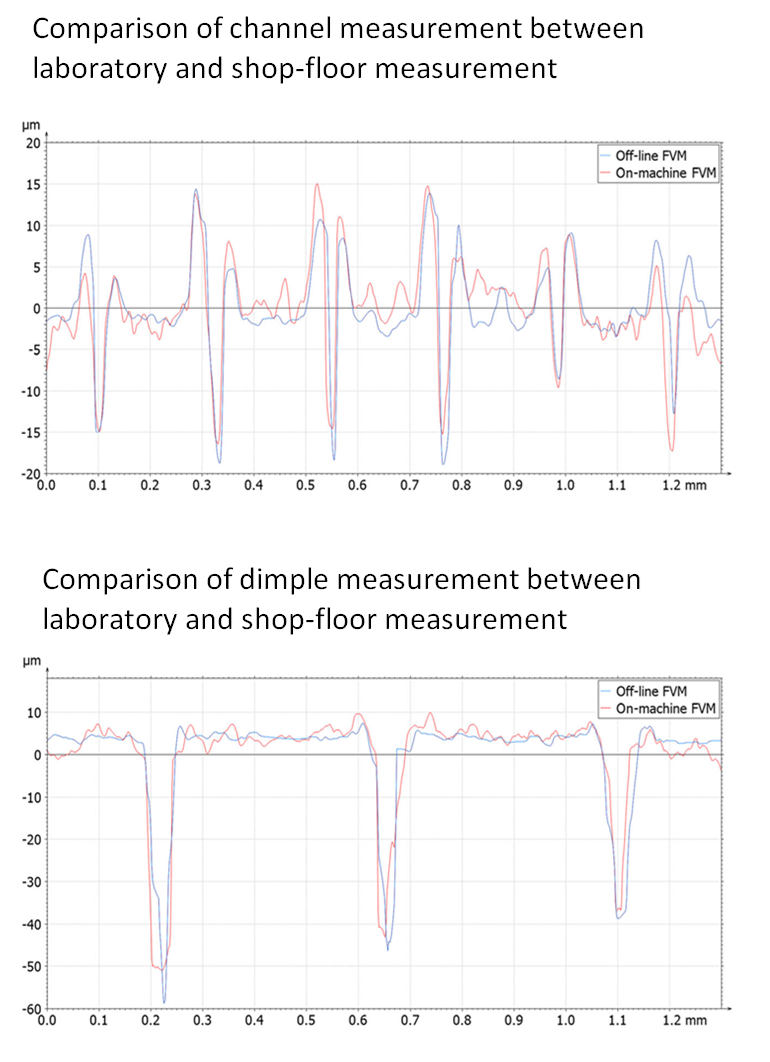
To understand the effect of the vibration on the measurement results of the on-machine measuring instrument, figure 8 below shows the head-to-head comparisons of channel and dimple measurements performed in two conditions: off-line (in a controlled laboratory) and on-machine (on a shop floor where vibrations are significant).
From figure 8, the effect of the vibration on on-machine measurement causes the vertical resolution of the measurement results to be reduced.
The measured valley obtained from the on-machine measurement is shallower than those obtained from the off-line measurement. Hence, the vibration causes a blurring effect in vertical directions.
This phenomenon should be considered when we perform measurement on a shop floor or inside a production machine.
READ MORE: Error sources on coordinate measuring machine (CMM) measurements and environment control
Conclusion
In this post, we have discussed the substantial effect of small vibrations on precise dimensional and surface topography measurements. Three case studies have been discussed: CMM measurements, surface measurement and on-machine dimensional measurement.
At micro-scale, vibration effect is significant and should be carefully considered. Moreover, the vibration effect is stronger on small feature size compared to big feature size.
A trade-of should be made between a maximum allowable measurement speed and expected accuracy. The faster the measurement speed, the higher the vibration effect will be.
Reference
[1] Wozniak, A., Krajewski, G. and Byszewski, M., 2019. A new method for examining the dynamic performance of coordinate measuring machines. Measurement, 134, pp.814-819.
[2] Forbes, A., 2024. CMM influence factors and uncertainty associated with length measurement. Applied Sciences, 15(1), p.271.
[3] Urban, J., Beranek, L., Koptiš, M., Šimota, J. and Košťák, O., 2020. Influence of CMM scanning speed and inspected feature size on an accuracy of size and form measurement. Manufacturing Technology, 20(4), pp.538-544.
[4] Barker, A., Syam, W.P. and Leach, R.K., 2016, October. Measurement noise of a coherence scanning interferometer in an industrial environment. In Proceedings of the thirty-first annual meeting of the American Society for Precision Engineering (Vol. 65, pp. 594-599).
[5] Santoso, T., Syam, W.P., Darukumalli, S., Cai, Y., Helmli, F., Luo, X. and Leach, R., 2020. On-machine focus variation measurement for micro-scale hybrid surface texture machining. The International Journal of Advanced Manufacturing Technology, 109(9), pp.2353-2364.
You may find some interesting items by shopping here.